
Overview
Final energy consumption in Sweden was around 31.3 Mtoe in 2022. This figure implies a decrease by 0.9 Mtoe since 2000, when consumption was almost 32.2 Mtoe. Energy consumption in the transport sector has shown a decrease by 0.47 Mtoe between 2000 and 2022. During the same period, industrial consumption decreased by 1.23 Mtoe and residential sector by 0.33 Mtoe. The service sector, including non-specified activities, saw an increase by 1.23 Mtoe.
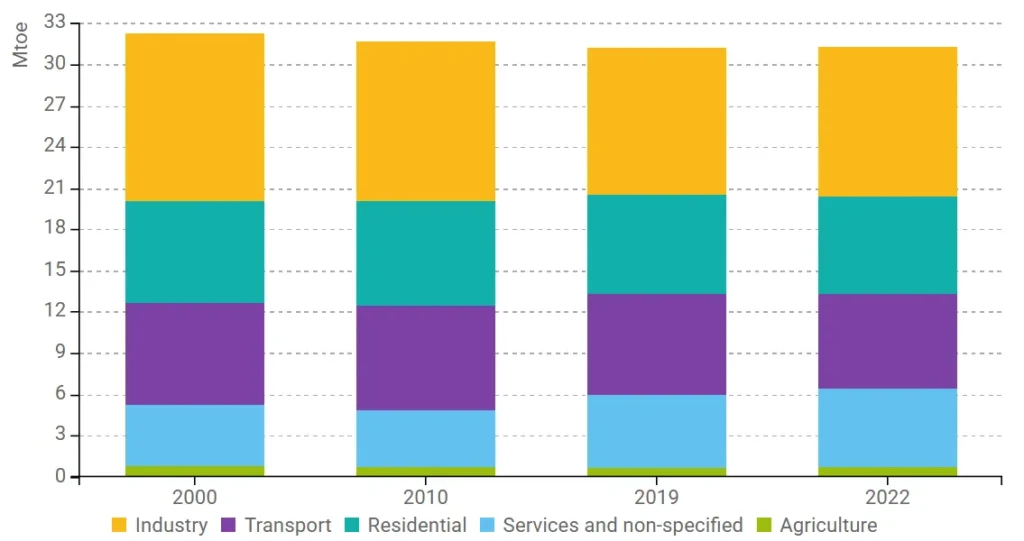
Figure 1: Final energy consumption by sector (with climatic corrections)
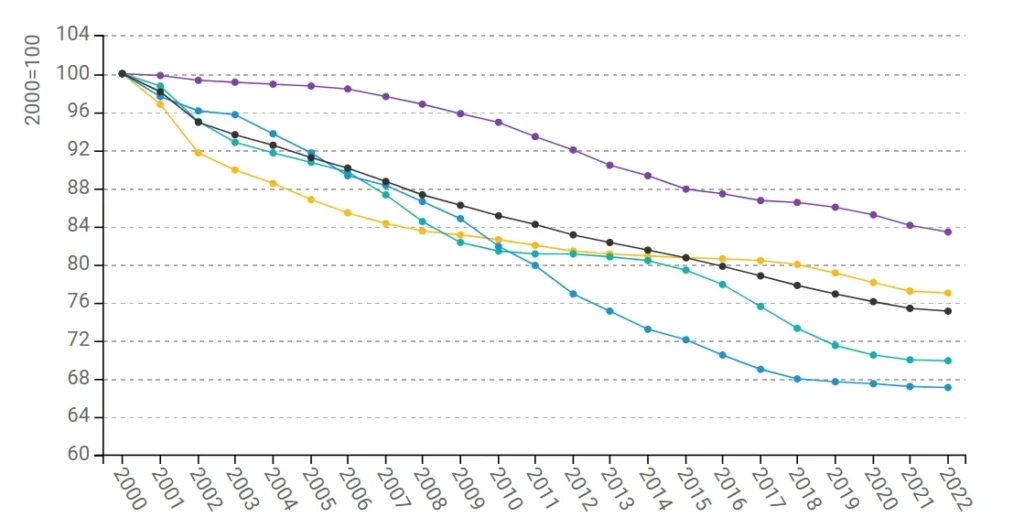
Figure 2: Technical Energy Efficiency Index
In 2022, Swedish energy savings highlight notable improvements across key sectors. Industry achieved the largest savings at 3.04 Mtoe, followed by residential at 2.65 Mtoe, services at 1.61 Mtoe, and transport at 1.46 Mtoe. The base year of 2000 sets the reference at zero, with consistent increases observed annually. The data underscores the effects of various efficiency initiatives, particularly in industry and households.
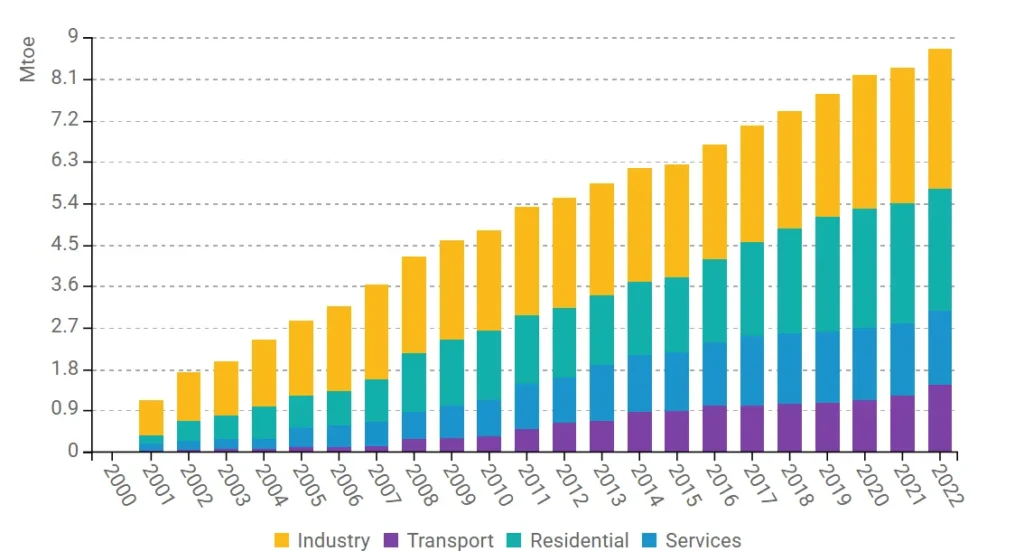
Figure 3: Energy savings by sector
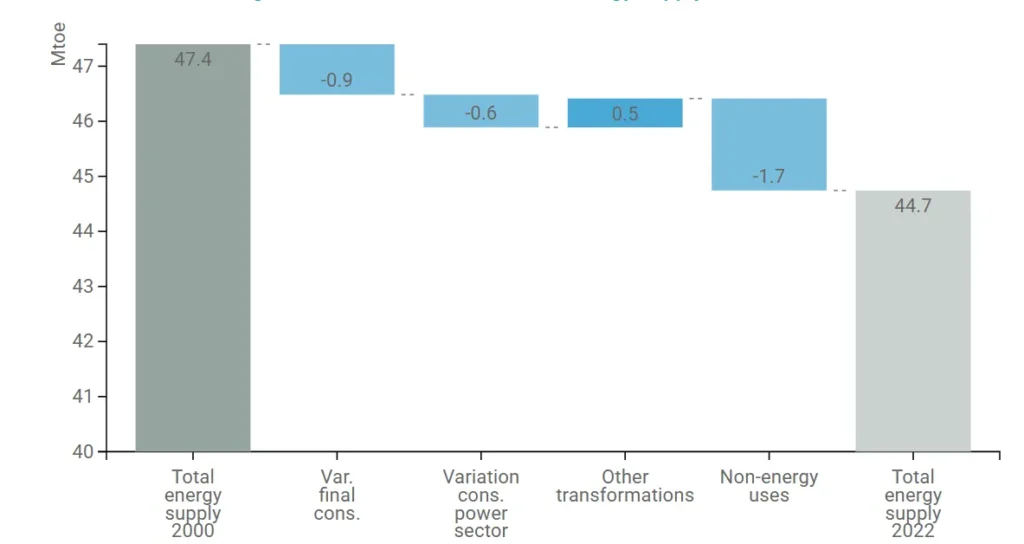
Figure 4: Main drivers of the total energy supply variation
Sweden’s final energy consumption decreased by 0.9 Mtoe, from 2000 (32.1 Mtoe) to 2022 (31.2 Mtoe). The largest upward driver is activity increase, adding 8.2 Mtoe, while Energy savings reduce consumption by 8.8 Mtoe. Structural changes, mostly in industry, account for a 3.2 Mtoe decrease, and ”other” factors add 2.9 Mtoe, offsetting some of the declines. This demonstrates that despite economic and societal growth, efficiency gains and structural shifts have contained final energy consumption.
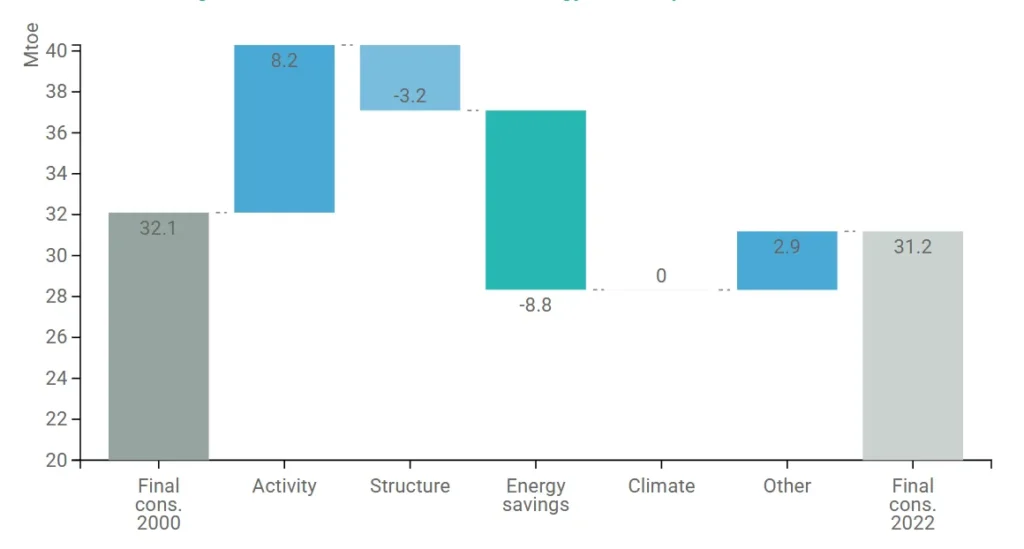
Figure 5: Main drivers of the final energy consumption variation
The foundation for Swedish energy efficiency policy is the tax on energy and carbon dioxide emissions. However, the effects stem not only from the tax itself, but also from the concurrent effects of other policy instruments. The tax creates a general incentive for action for reduced energy use, but because of its broad approach, further instruments are needed to target specific groups of users. Sweden has a national energy efficiency target for a reduction of the ratio between primary energy consumption and GDP by 50% for the period 2005-2030. Already by 2017 a reduction of 20% was registered. However, because primary energy consumption and GDP do not correlate in a 1:1 relation, there always exists a risk that the gains in one or several years in a row may be reversed in subsequent years. Data for 2021 show 33% reduced energy use.
| Measures | Description | Expected savings, impact evaluation |
| Support for developing energy and climate actions among public bodies/ Stöd för att utveckla energi- och klimatarbete hos offentliga aktörer | Project for capacity building in the areas of energy and climate, such as cooperation, method development, and dissemination of experiences. | 1.26 TJ |
| Klimatsynk – national cooperation for energy and climate | The purpose of Klimatsynk synchronized approach is to avoid overlapping projects and to disseminate new knowledge between regions. | 3.77 TJ |
| Support for developing energy and climate actions among public bodies/ Stöd för att utveckla energi- och klimatarbete hos offentliga aktörer | The Swedish Energy Agency distributed a total of EUR 5 million (annually approximately EUR 1.5 million) between 20016 and 2019 to local and regional public bodies for actions promoting energy and climate targets. | 1.26 TJ |
Buildings
Sweden’s final energy consumption in residential buildings sector has decreased by 0.33 Mtoe at normal climate between 2000 and 2022. Over the same period, consumption in the services sector decreased by 0.27 Mtoe.
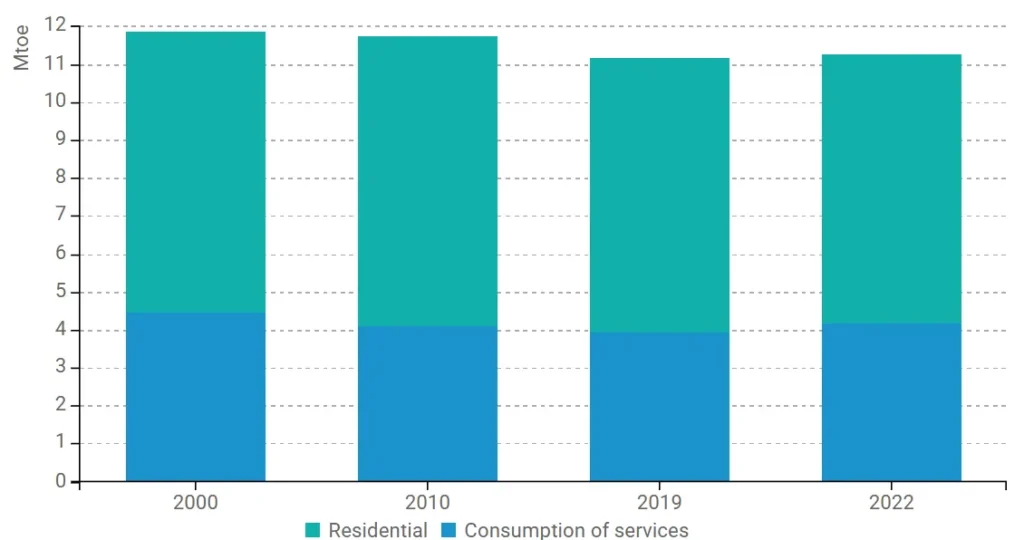
Figure 6: Final energy consumption in buildings (with climatic corrections)
Swedish households’ final energy consumption, adjusted for climate variations, has shifted by end-use between 2000 and 2022. Space heating decreased by 20% from 5.18 Mtoe to 4.12 Mtoe, and water heating by 14% from 1.19 Mtoe to 1.02 Mtoe, indicating some efficiency gains or changes in heating pratices. Meanwhile, energy consumption for electrical appliances and lighting increased by 22% from 1.24 Mtoe to 1.51 Mtoe.
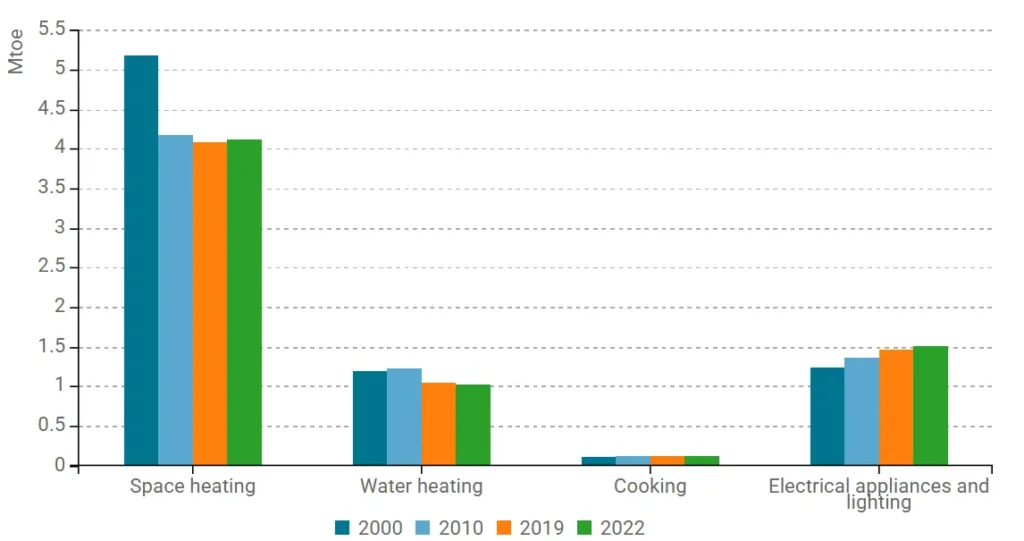
Figure 7: Energy consumption by end-use of households (with climatic corrections)
Energy consumption of space heating per m2 has shown a significant downward trend between 2000 and 2022, from 11.5 to 7.88 koe/m2 (-1.7%/year), although there are of course annual variations. This is largely due to more energy efficient buildings (building materials, windows) or fuel substitution (e.g. installing heat pumps). Electrical appliances and lighting consumption has increased by 3.0 % between 2000 and 2022 to reach 0.328 toe per dwelling. On the contrary, water heating consumption per dwelling has decreased from 0.28 toe to 0.22 toe (-1.1%/year). There is also a slight increase in energy used for cooking.
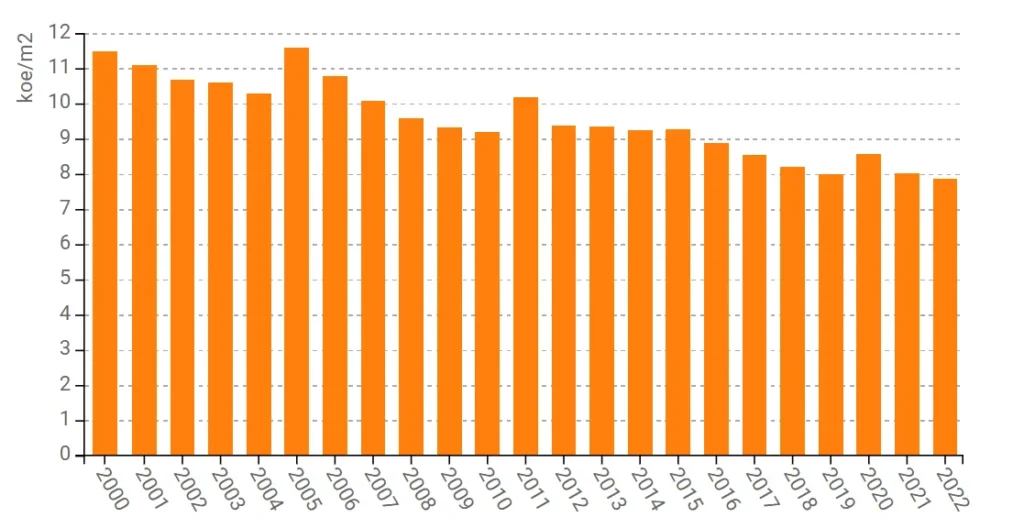
Figure 8: Energy consumption of household space heating per m2 (with climatic corrections)
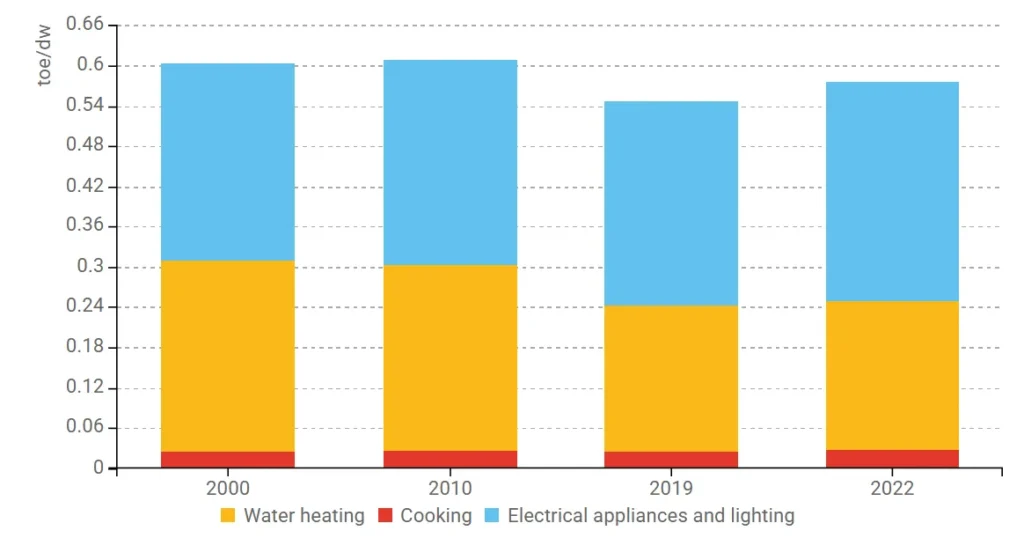
Figure 9: Energy consumption per dwelling by end-use (except space heating)
Figure 10 below shows that Swedish household’s electricity consumption per dwelling, adjusted for climate variation, has shifted between 2000 and 2022. Thermal uses (e.g. heating systems) slightly decreased from 4390 kWh/dw to 4361 kWh/dw which indicates efficiency gains or changed heating practices. Electricity for appliances and lightning rose from 3420 kWh/dw to 3820 kWh/dw.
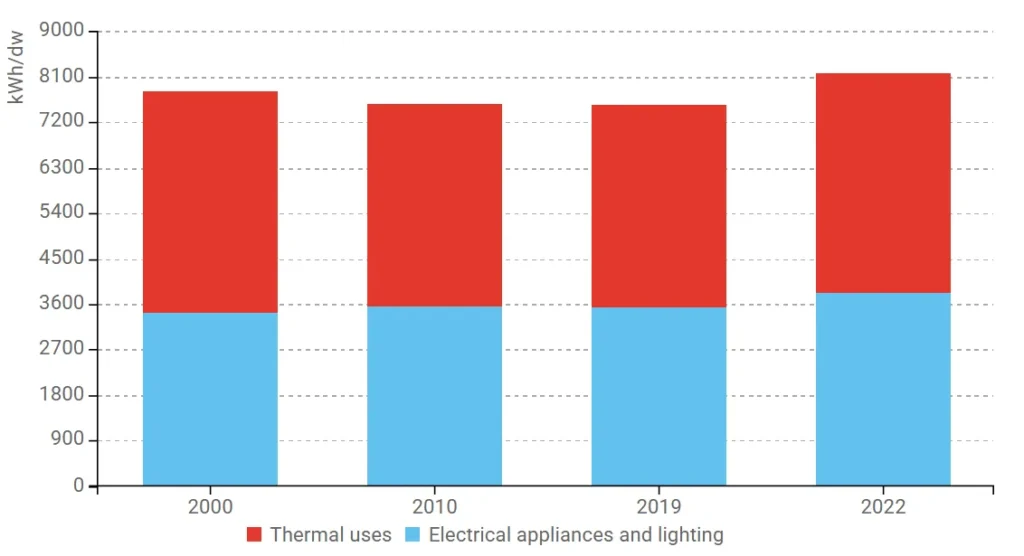
Figure 10: Electricity consumption per dwelling by end-use (with climatic corrections)
Total energy consumption of households decreased by 0.33 Mtoe between 2000 and 2022, from 7.29 to 6.96 Mtoe. The single most important factor pulling down energy use is energy savings, amounting to 2.65 Mtoe. This is however counterbalanced by upward trends, such as the increasing number of dwellings, more appliances per dwelling and larger homes.
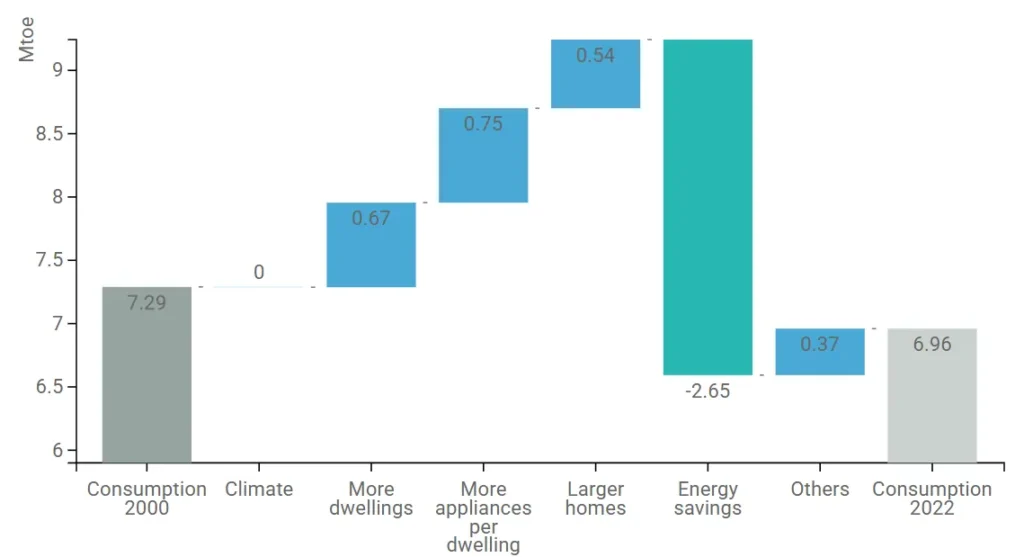
Figure 11: Main drivers of the energy consumption variation in households
Between 2000 and 2022, space heating consumption for households decreased by 1.02 Mtoe from 4.98 Mtoe to 3.96 Mtoe. Single most important factor pulling down energy used in space heating is savings by 1.69 Mtoe. Activity and larger homes are factors that are pulling upp the energy use.

Figure 12: Main drivers of the space heating consumption variation of households
Most notable change is in the services by branch is ”Other services”, which dropped from 1.35 Mtoe to 1.1 Mtoe between 2000 and 2022. Energy consumption in health services also declined, from 0.52 Mtoe to 0.45 Mtoe, while hotels and restaurants increased from 0.18 Mtoe to 0.24 Mtoe. Other branches remained relatively stable, exhibiting only minor fluctuations in energy use.
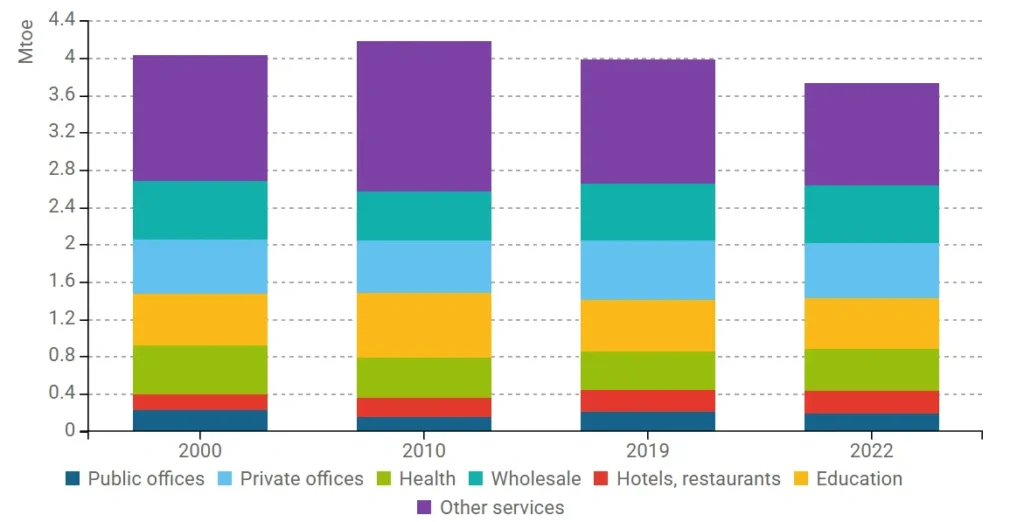
Figure 13: Final energy consumption of services by branch
Electricity consumption per m² in services has increased by 17.8% over the period 2000-2022. Energy consumption per m2 in services has decreased by 10% over the period 2000-2022.
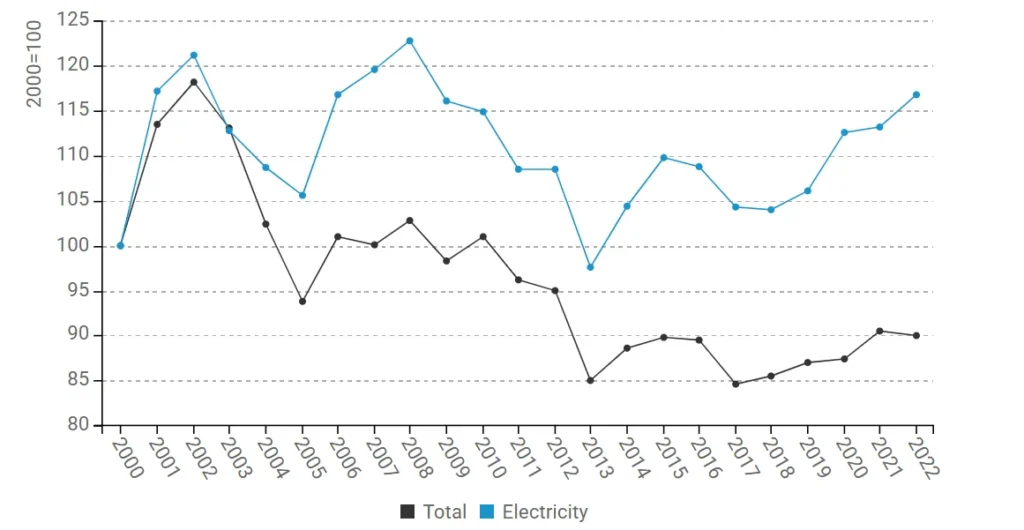
Figure 14: Energy and electricity consumption per m² in services (with climatic corrections)
| Measures | Description | Expected savings, impact evaluation |
| Programme for buildings with very low energy use (LÅGAN) | Usually perceived as a part of technology procurement groups. | 0.97 TJ |
| EU-related: Energy Performance of Buildings (2002/91/EC) amendment (2018/844/EU) | The prime responsibility for actions implementing this directive is with the Swedish National Board of Housing, Building, and Planning (Boverket), which is the issuing authority of the Building Codes (Byggregler). Currently, a project of simplifying these are under way. | 0.32 TJ |
| Investment support for photovoltaic cells | The support programme was running between 2000 and 2020. The purpose was to encourage the use of solar heating technology for heat supplies to detached houses and apartment buildings and to promote an efficient and environmentally beneficial utilization of energy. . The support was 20 % of the total costs. The scheme was funded by SEK 736 million in 2019. | 0.32 TJ |
References: ODYSSEE-MURE, “Country profiles: EU Energy Efficiency & Trends policies.