
Overview
Final energy consumption in 2022, corrected for temperature variations, was about 40 Mtoe (see Figure 1). The figure also shows energy consumption in 2019, the latest ‘normal’ year, i.e. before the Covid epidemic starting in 2020 that had a large impact on transport volume and before the very high energy prices due to the war in Ukraine. The consumption in all sectors was lower in 2022 than in 2019. Not all of this reduction was due to energy efficiency as we will see later. The much lower energy consumption in the agriculture sector, that is dominated by horticulture, was a result of the high energy prices in 2022.
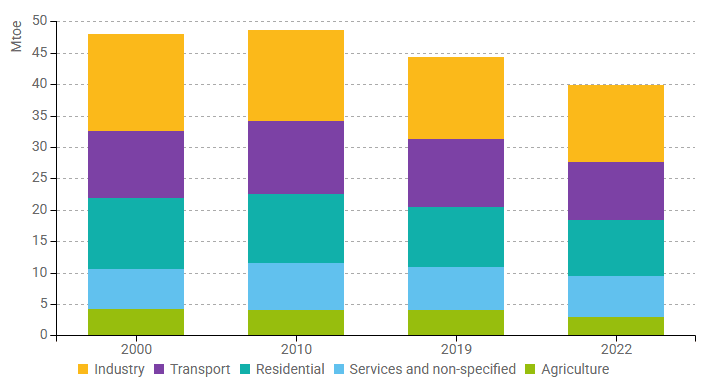
Figure 1: Final energy consumption by sector (with climatic corrections)
Efficiency for total final energy consumption, as measured by the so-called technical ODEX, has improved by around 1.6% per year since 2000. This can be derived from the value if 70 of the total ODEX in 2022 shown in Figure 2. Smaller than average annual gains have been achieved in services (1.1%/year) and especially in transport (0.3%/year), larger gains were achieved in the residential sector (2.4%/year) and in industry (2.2%/year). The highest efficiency improvement since 2019 thus occurred in the households sector, which was caused by the high energy prices towards the end of 2021 and in 2022.
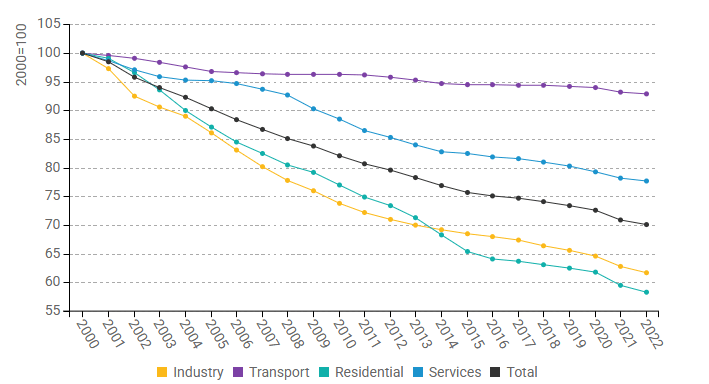
Figure 2: Technical Energy Efficiency Index
Figure 3 shows that cumulative annual energy savings have also been highest in the residential sector and in industry. In the residential sector this was mainly the result of high efficiency boilers and insulation measures. In industry, the results may be distorted by the fact that in the chemical industry, which uses more than half of the final energy in Dutch manufacturing, the industrial production index IPI (based on changes in added value) is used as the production volume. This means that energy savings in the chemical industry seem to improve when higher value products are produced. Again, it is quite clear energy savings in transport stay far behind.
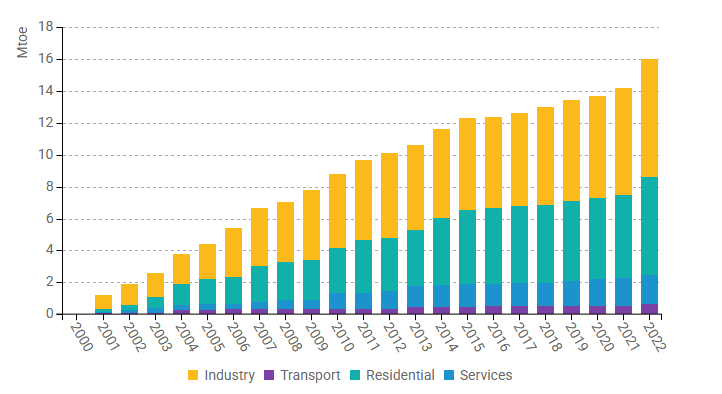
Figure 3: Energy savings by sector
Total energy supply decreased by 10.6 Mtoe between 2000 and 2022. Figure 4 shows that this was the result of a lower final energy consumption (-8.3 Mtoe), lower consumption of the power sector (-1.3 Mtoe) and lower non-energy use (-1 Mtoe). The lower power sector consumption was the result of opposite trends: higher power consumption (3.1 Mtoe), a shift from net import to export of electricity (2 Mtoe) and a less efficient fuel mix in thermal power plants (a higher share of biomass, 1.4 Mtoe). This was more than mitigated by a higher share of wind and solar (-3.7 Mtoe) and a higher efficiency of thermal power plants (-4 Mtoe).
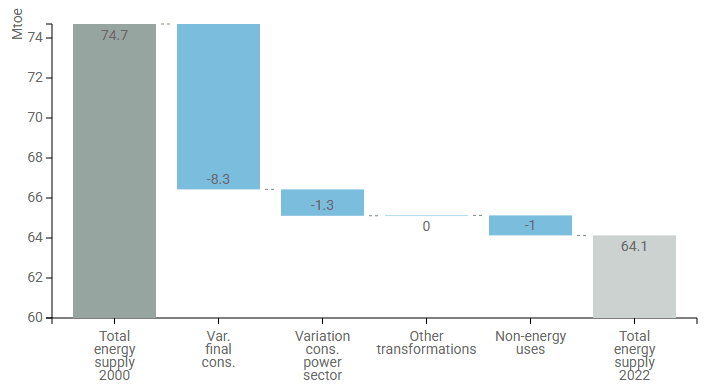
Figure 4: Main drivers of the total energy supply variation
Despite an increase of energy consuming activities and a shift to a more energy-intensive structure of the economy, the total final energy consumption decreased by over 8 Mtoe between 2000 and 2022, as can be seen in Figure 5. Energy savings more than compensated the increasing effect of activities and structure, and “other” effects, which include behavioural change, also led to a lower energy consumption.
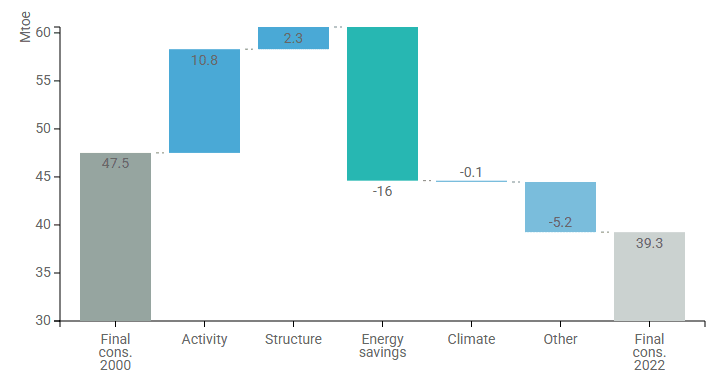
Figure 5: Main drivers of the final energy consumption variation
The Netherlands aims to be part of a climate-neutral Europe in 2050. In order to achieve climate-neutrality in 2050, the Dutch national interim target for 2030 has been tightened to at least a 55% net greenhouse gas reduction in 2030 compared to 1990. To ensure that this target is achieved, it has been agreed to focus policy on a higher target of approximately 60% in 2030. This policy is elaborated in the Climate Policy Program that was published in June 2022 and the additional policy package that the cabinet agreed on in April 2023 (“Voorjaarsbesluitvorming Klimaat”).
Many of the current and proposed greenhouse gas mitigation measures will stimulate energy efficiency. However, for the Netherlands, energy efficiency will also be directly addressed through the implementation of the revised EU Energy Efficiency Directive (EED). As part of the Fit for 55 agreement, the EED makes it binding for EU countries to collectively ensure an additional 11.7% reduction in energy consumption by 2030, compared to the 2020 reference scenario projections. The Dutch government is developing indicative sectoral target values for energy savings in order to fulfil its national contribution towards this goal.
Some general measures with high impact are described in the table below.
| Measures | Description | Expected savings, impact evaluation |
|---|---|---|
| Climate Policy Programme (Beleidsprogramma Klimaat) | This policy program contains the main lines of climate policy including 2030 – aimed at realisation of the targets from the Climate Act. | High |
| Energy taxes and surcharges | The energy tax is levied on electricity and natural gas, and the level depends on the level of energy consumption of a customer (degressive tariff structure). | High |
| EIA: Energy Investment Allowance (NL: Energie-investeringsaftrek) | Deduction scheme from fiscal profits to promote investments in new energy efficient technologies. | High |
Buildings
As can be seen in Figure 6, the energy consumption of the built environment decreased between 2010 and 2022; it increased between 2000 and 2010 because of more energy use in the services sector. In contrast, the consumption in the households sector showed a more consistent decreasing trend between 2000 and 2022.
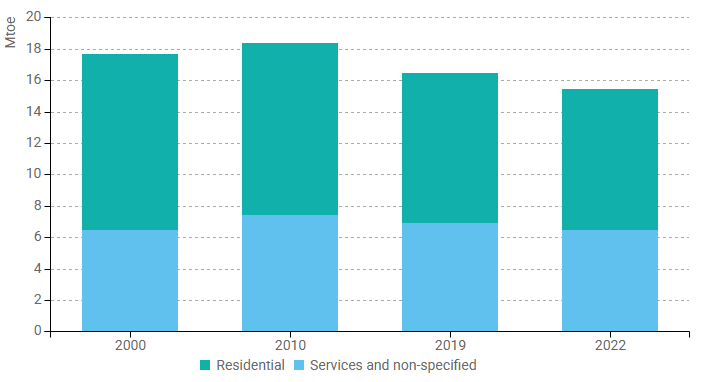
Figure 6: Final energy consumption in buildings (with climatic corrections)
Figure 7 shows that the large majority of energy consumption reduction in households was achieved in space heating. Electrical appliances used more than in 2000, lighting and cooking less.
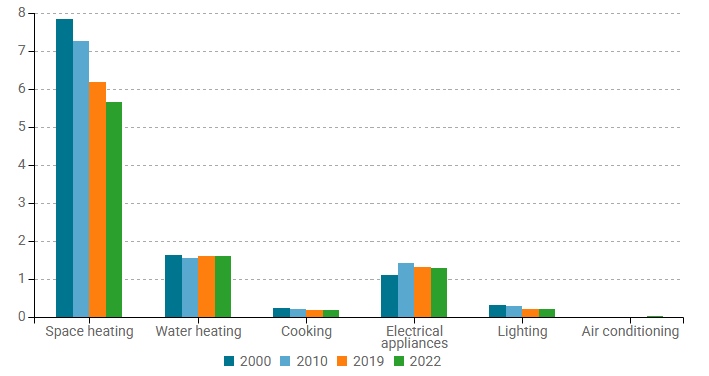
Figure 7: Energy consumption by end-use of households (with climatic corrections)
The energy used for space heating per square meter in households has decreased steadily until 2015 as is visible in Figure 8. A large part of the reduction is due to better insulation and a grown share of high efficiency condensing boilers. Between 2015 and 2021, energy consumption per square meter remained roughly at the same level. The decrease in 2022 is related to the high energy prices in late 2021 and 2022, which was related to the war in Ukraine. This led to more economical heating behaviour.
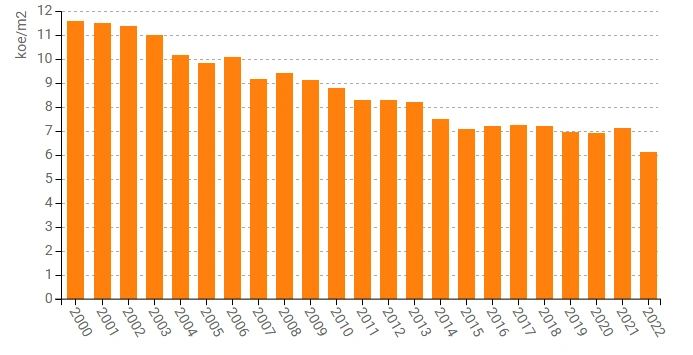
Figure 8: Energy consumption of household space heating per m2 (with climatic corrections)
The reduction of energy consumption per dwelling for other uses than space heating is depicted in Figure 9. The energy used for water heating has decreased consistently between 2000 and 2022, the consumption by electrical appliances and lighting decreased after 2012 despite a higher number of electrical appliances because of increased efficiency. The improved efficiency of appliances can for a large part be attributed to the Ecodesign directive.
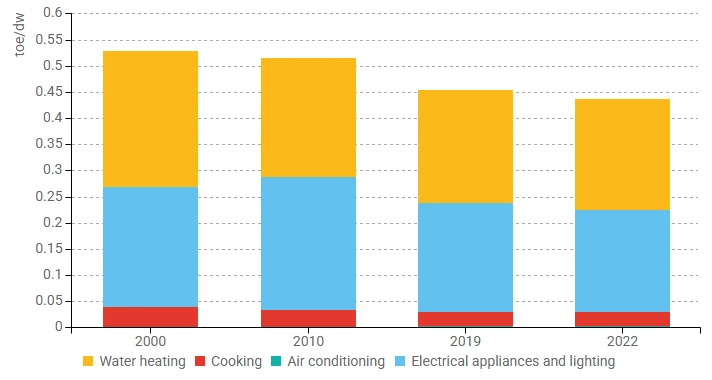
Figure 9: Energy consumption per dwelling by end-use (except space heating)
The different uses of electricity consumption per dwelling are shown in Figure 10. Electrical appliances use the majority of electricity. They have become consistently more efficient since 2000, especially after the introduction of the Ecodesign directive, as has lighting. Thermal use has gone up because of a larger number of heat pumps, and in later years more air conditioners.
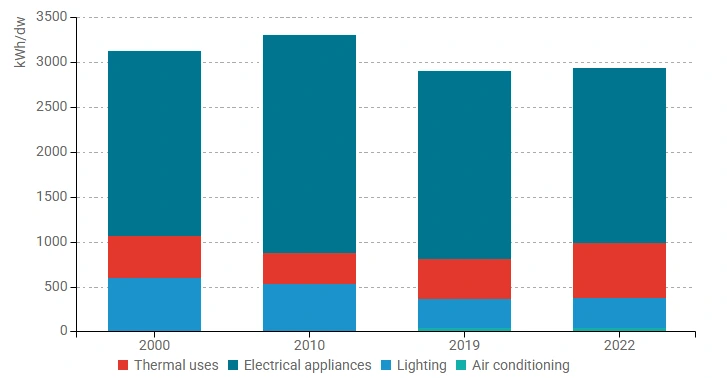
Figure 10: Electricity consumption per dwelling by end-use (with climatic corrections)
Figure 11 shows that the total energy consumption in the households sector has decreased between 2000 and 2022, despite the fact that there were more dwellings, more appliances per dwelling and homes became larger. All these effects were more than compensated by energy savings, mainly by insulation and more efficient heating systems. ‘Other’ effects also lowered energy consumption. These combine two opposite effects: a reduction due to more economical heating behavior (-1.23 Mtoe), especially linked to higher energy prices towards the end of 2021 and in 2022, and an increase due the ambient heat of heat pumps (+0.27 Mtoe).
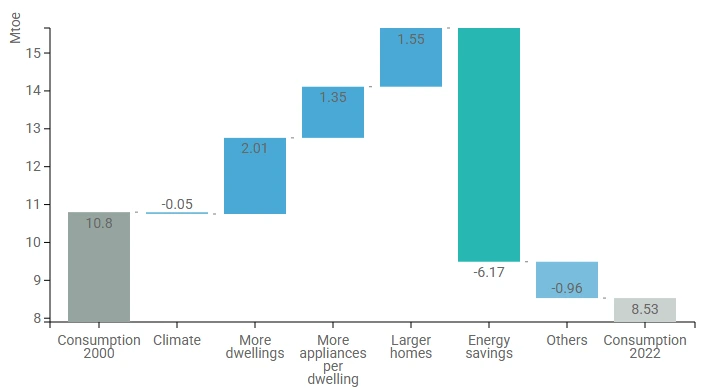
Figure 11: Main drivers of the energy consumption variation in households
Figure 12 shows the same decomposition pattern of energy use for space heating in dwellings as Figure 11 shows for the total energy consumption. This is an indication of the fact that space heating dominates energy consumption in dwellings as well as energy savings.
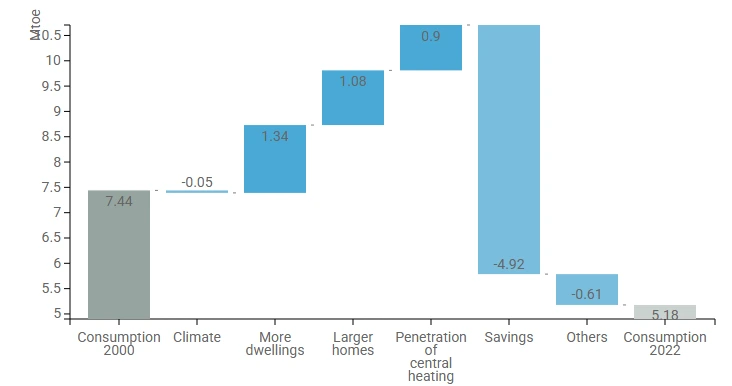
Figure 12: Main drivers of the space heating consumption variation of households
Energy consumption in the services sector decreased after 2010, as reflected in Figure 13. Energy use of private offices and education remained more or less stable since 2014. The consumption in the health and wholesale sectors decreased steadily since 2014. The consumption in hotels and restaurants is the exception with a slightly increasing energy consumption trend since 2014.
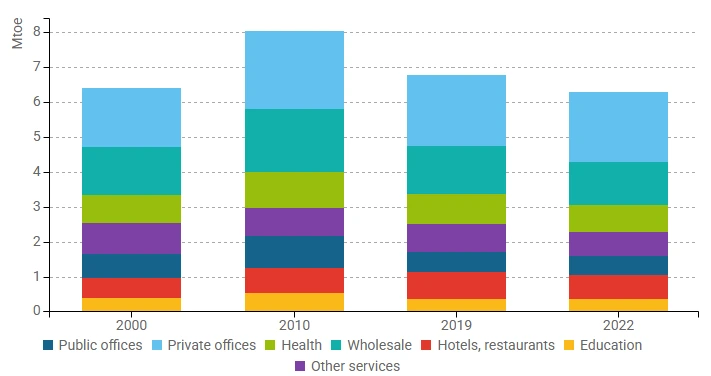
Figure 13: Final energy consumption of services by branch
The total energy consumption per square meter in the services sector decreased while that of electricity increased, as can be seen in Figure 14. This is because savings in space heating by insulation and more efficient heating had a larger effect than the increased electricity consumption.

Figure 14: Energy and electricity consumption per m² in services (with climatic corrections)
In line with the Netherlands’ broader energy and climate policy, the sustainability of the built environment is primarily focused on CO2 reduction. The current target for the built environment, agreed to as part of a policy package in April 2023 (“Voorjaarsbesluitvorming Klimaat”) is an emission ceiling of 13.2 Mt of CO2-equivalents in 2030.
The core of the Dutch approach in the built environment is reducing energy demand through behaviour, insulation and hybrid heat pumps, and developing sustainable heat sources to meet the remaining demand. This happens via multiple tracks simultaneously: both through an area-oriented approach via municipalities (based on heat transition visions, district implementation plans, and energy fix teams in response to energy poverty) and with policy for individual homes and buildings (on topics such as energy labelling, nearly zero-emission buildings, public building renovation).
Some measures with high impact in the built environment are described in the table below.
| Measures | Description | Expected savings, impact evaluation |
|---|---|---|
| National Heat Fund (Nationaal Warmtefonds) | The National Heat Fund (Nationaal Warmtefonds) is a revolving fund for heat projects and other sustainability measures for owner-occupants and homeowners’ associations. It follows up on the earlier national energy loan fund possibilities (NEF). The terms and conditions for citizens were revised a number of times and owners’ associations were also included in order to boost the fund. | High |
| Investment Subsidy for Sustainable Energy (ISDE) (NL: Investeringssubsidie Duurzame Energie) | Households and small commercial users can apply for an allowance for the purchase of heat pumps, biomass boilers, solar water heaters, pellet stoves and small wood-fired boilers. | High |
| Energy saving & reporting obligation | Companies that consume in excess of 50 000 kWh of energy or 25 000 m3 of gas are required to adopt energy saving measures with a payback time of 5 years or less. Since 2019, a mandatory reporting of measures taken was introduced (Informatieplicht) | High |
References: ODYSSEE-MURE, “Country profiles: EU Energy Efficiency & Trends policies.