

Overview
Climate-corrected Total Final Energy Consumption (TFC) was 23 Mtoe in 2022, the same as in 2000. Industry is the largest energy consuming sector accounting for 42% of the TFC in 2022 which is 7.4 percent points less than in 2000. The proportion of transport in TFC was 17%, the same as in 2000. The share of the residential sector was 24% and that of the services sector 14%, with both sectors expanding their share of the total since 2020.
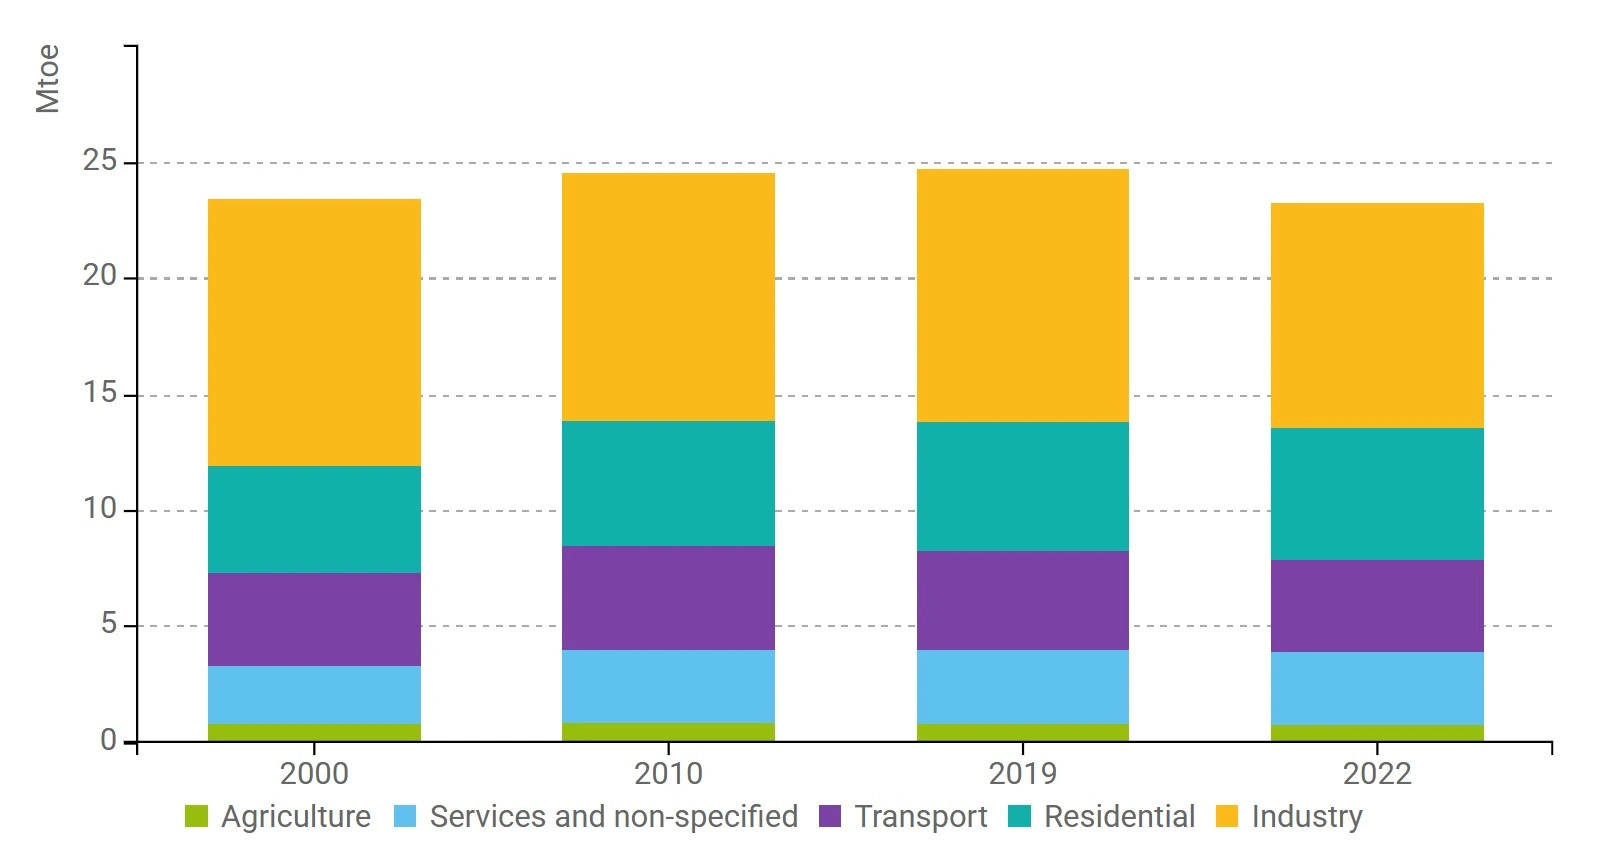
Figure 1: Final energy consumption by sector (with climatic corrections)
Energy efficiency of final energy consumption sectors, as measured by ODEX, improved by 17% over the 2000-2022 period, i.e. 0.7%/year on average. ODEX improved most in the residential sector (1.1%/year) and least in the services sector and in industry.
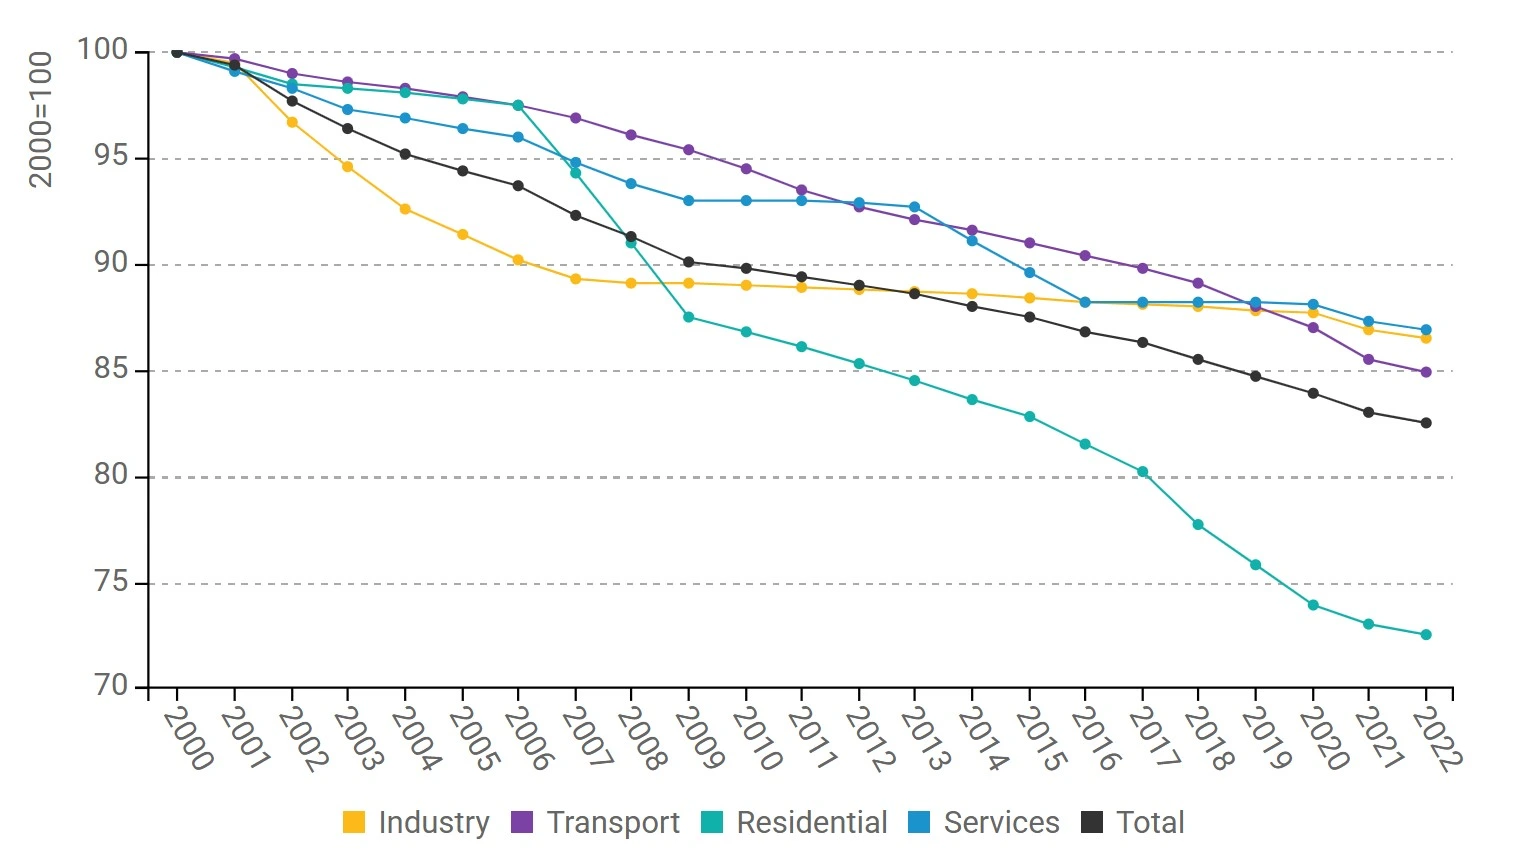
Figure 2: Technical Energy Efficiency Index
Energy savings achieved in the period 2000-2022, calculated with top-down Odyssee indicators, reached 4.8 Mtoe in 2022. Savings in industry made the largest contribution (1.9 Mtoe) followed by the residential sector (1.8 Mtoe). Note: There is a break in the statistical data series for the residential sector in 2007-2008.

Figure 3: Energy savings by sector
Finland’s total energy supply was 31.7 Mtoe in 2022 declining by 0.7 Mtoe (2.2%) from the 2000 level. Changes in the power mix and in final energy consumption both had a very small contribution to the observed changes while use of fuels for non-energy uses has increased. Efficiency improvements in “Other transformations” can be attributed to district heat supply, where use of waste heat and flue gas scrubbers have been increasing. Use of highly efficient CHP has had an important role in Finland already for several decades.

Figure 4: Main drivers of the total energy supply variation
Although the final energy consumption in 2022 was at the same level as in 2000, several factors had opposing effects offsetting each other. Economic activity and other sectoral activity factors have increased consumption. Energy savings (as measured by ODEX) and structural effects have reduced consumption, by 4.8 Mtoe and 2.5 Mtoe, respectively.

Figure 5: Main drivers of the final energy consumption variation
Finland’s Integrated Energy and Climate Plan of June 2024 contains the national targets and the related policy measures to achieve the EU’s energy and climate targets. In accordance with the EED (2012), Finland’s indicative national energy efficiency target for 2020 was 310 TWh absolute level of final energy consumption. The realized level was 271 TWh. The energy efficiency target to contribute to EU 2030 target in final energy consumption is capping Finland’s final energy consumption at 239.6 TWh, calculated with EED (2023) Annex 1 formula.
Buildings
Climate-corrected final energy consumption has grown by 26% in service sector buildings and by 24% in residential buildings from 2000 to 2022. Floor area in the services sector increased by 54% and in dwellings by 36%, and the number of households increased by 23% over the same period.
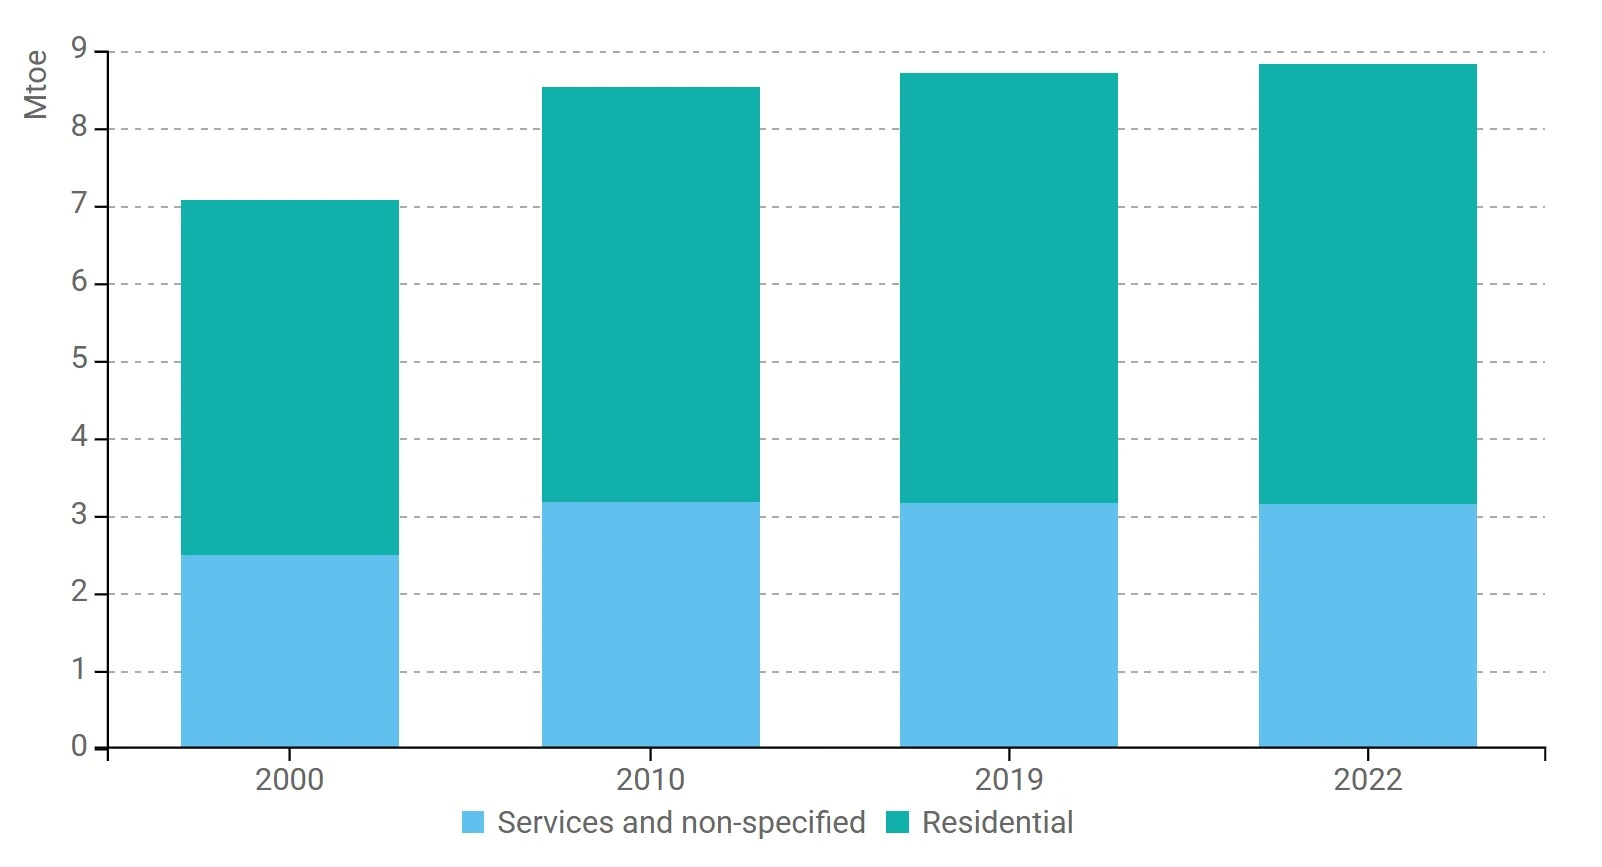
Figure 6: Final energy consumption in buildings (with climatic corrections)
Figure 7 illustrates the proportion of different end-uses in households. Space heating dominates the consumption with 67% share. The share of water heating is 16% and that of appliances and lighting 15%, whereas cooking and air-conditioning have negligible contributors.
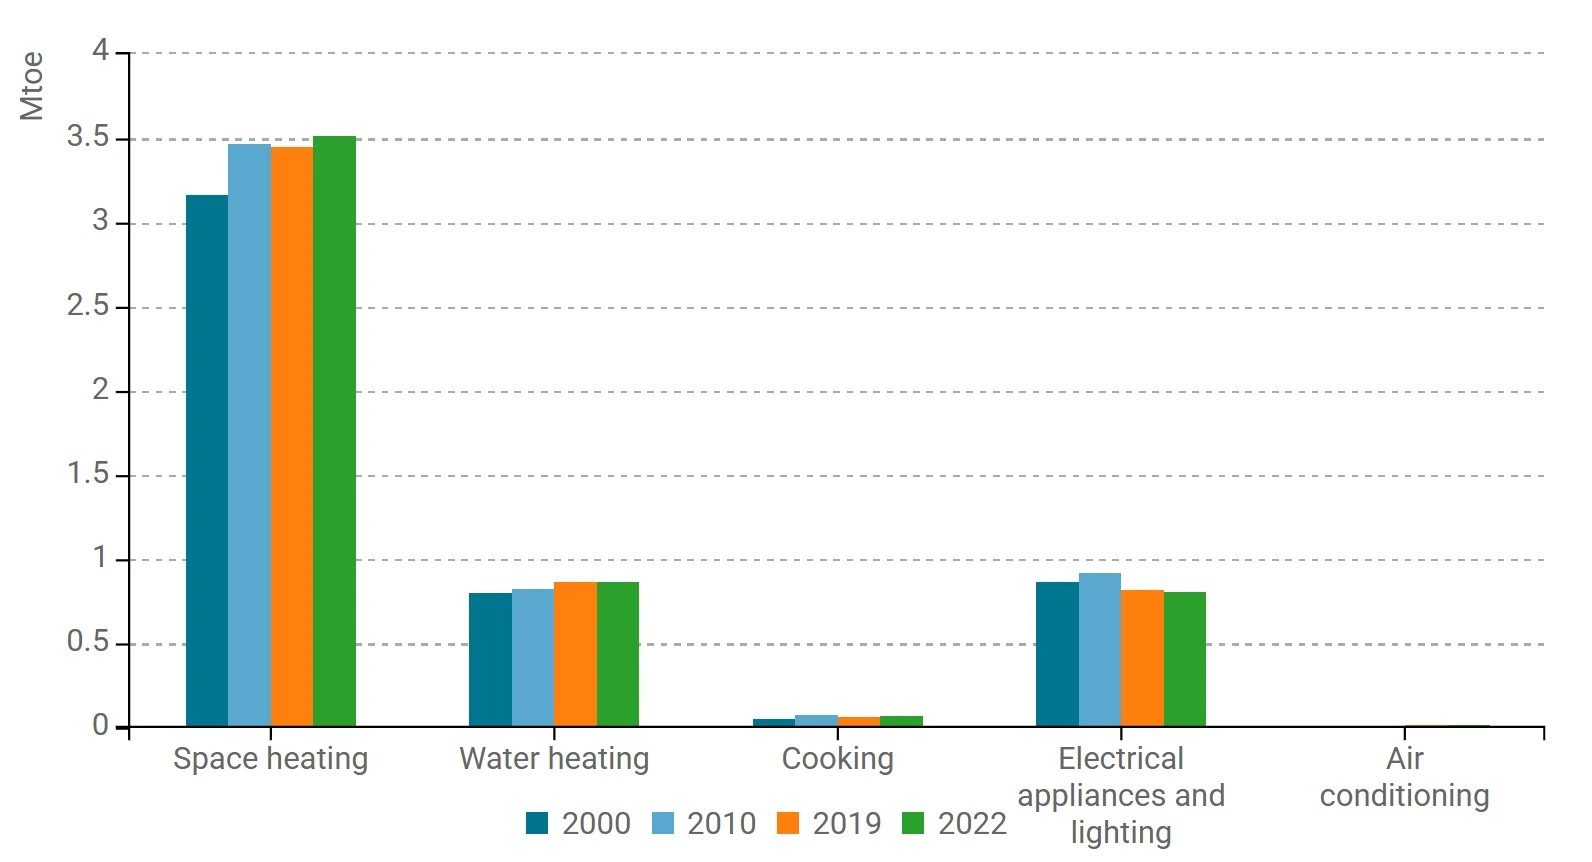
Figure 7: Energy consumption by end-use of households (with climatic corrections)
Unit consumption for space heating per m2 in households has declined by about 16% (i.e. 0.8%/year) since 2000 (Figure 8). This change is considerable as unit consumption includes ambient heat used by heat pumps; without ambient heat the reduction rate was almost 40% faster (1.1%/year). Small annual variations in the long-term trend can be attributed to the fact that normalization with heating degree days does not “perfectly” correct the impact of weather.
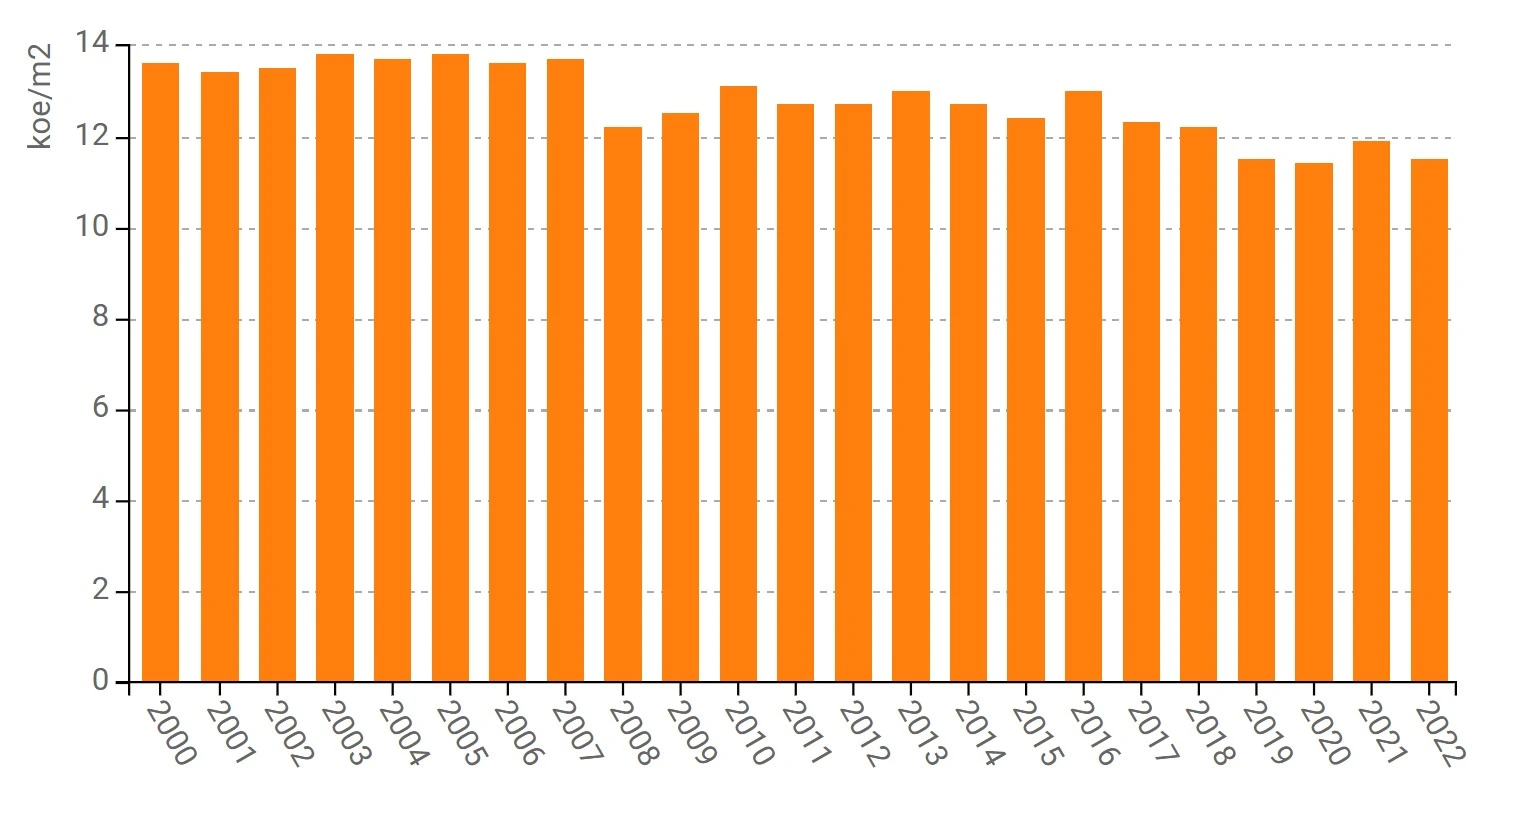
Figure 8: Energy consumption of household space heating per m2 (with climatic corrections)
Energy consumption of water heating and electric appliances in dwellings has decreased, by 13% (i.e. 0.6 % per year) and 26% (1.1% per year), respectively. Eco-design policy has contributed significantly to the reduction of electricity use in households. Other uses, namely air conditioning and cooking, remain negligible.
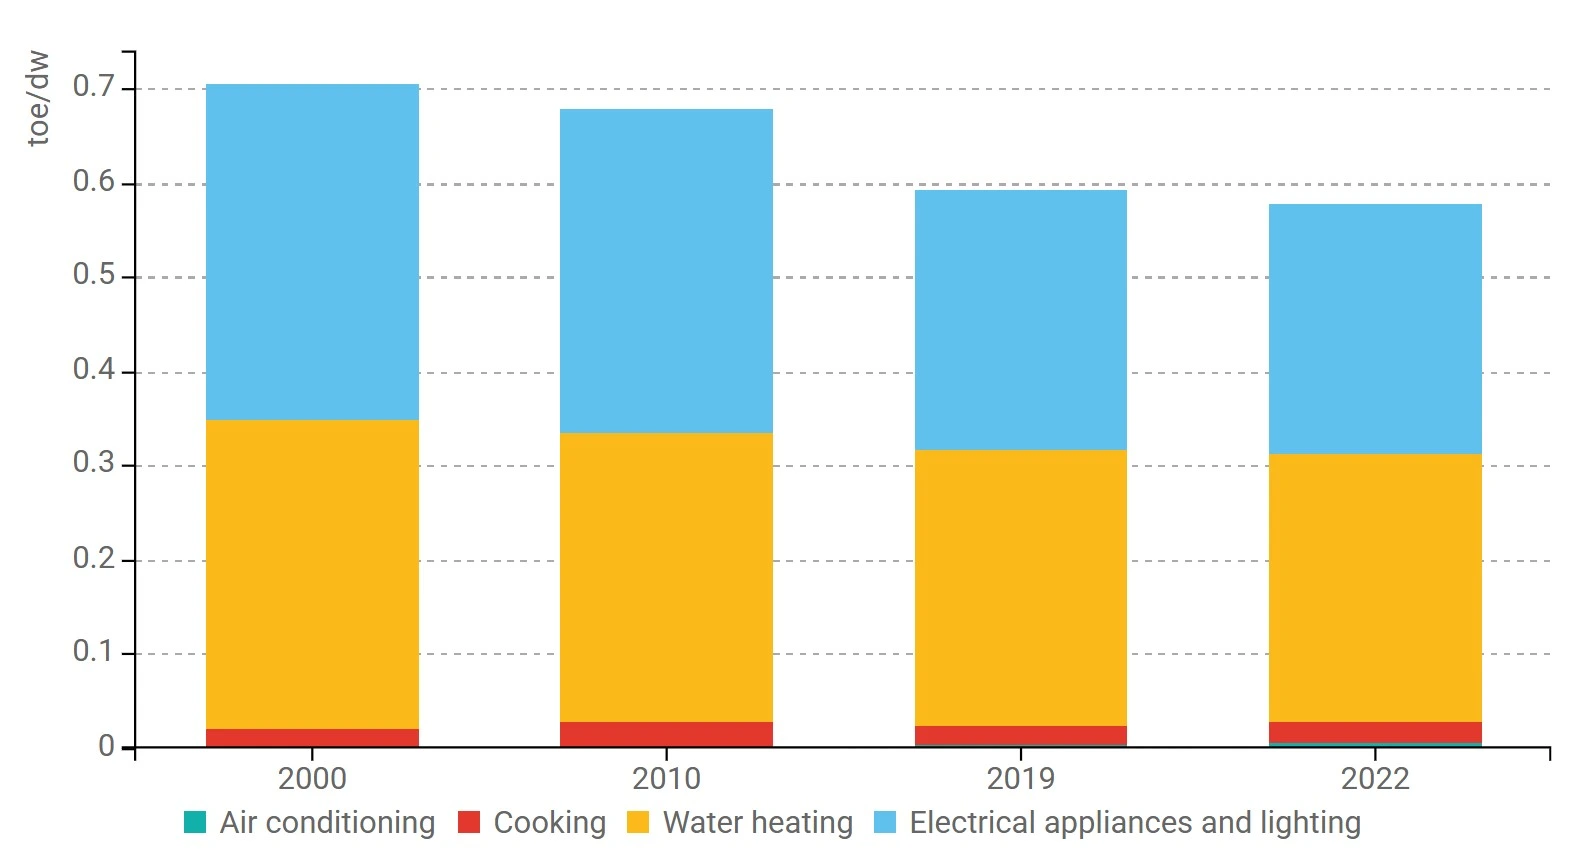
Figure 9: Energy consumption per dwelling by end-use (except space heating)
Electricity consumption (with climatic correction) per dwelling has declined by since 2010 by 12%. The change in lighting is the most significant (-55%) but there is a positive development also in use for electric appliances (-12%). Thermal use is rather steady; while the number of heat pumps has been increasing, they often replace direct electric heating.
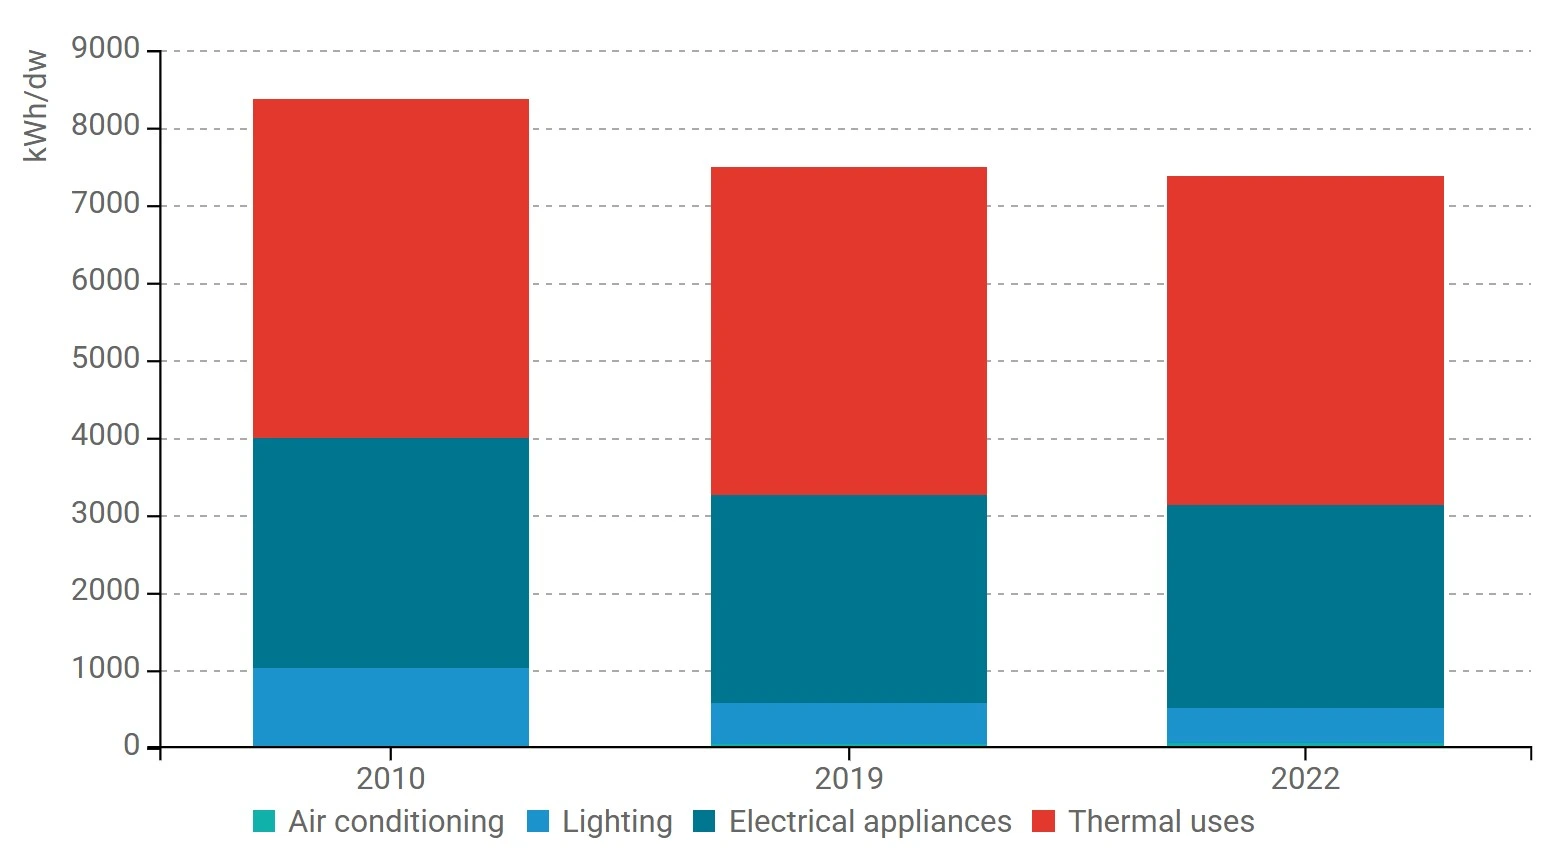
Figure 10: Electricity consumption per dwelling by end-use (with climatic corrections)
Energy consumption in the residential sector has increased by 1.1 Mtoe (12.9 TWh) since 2000. It was driven upwards particularly by the continuously increasing number of dwellings, while the growth in the average size of homes has had only a marginal effect since 2010. On the other hand, energy savings fully offset the effect of these two drivers of consumption growth. Consumption growth was strongly affected by “other” factors, which include the increased use of ambient heat (+0.7 Mtoe) and behavioural changes, including increased presence at home during and after the COVID-19 pandemic (+0.8 Mtoe).
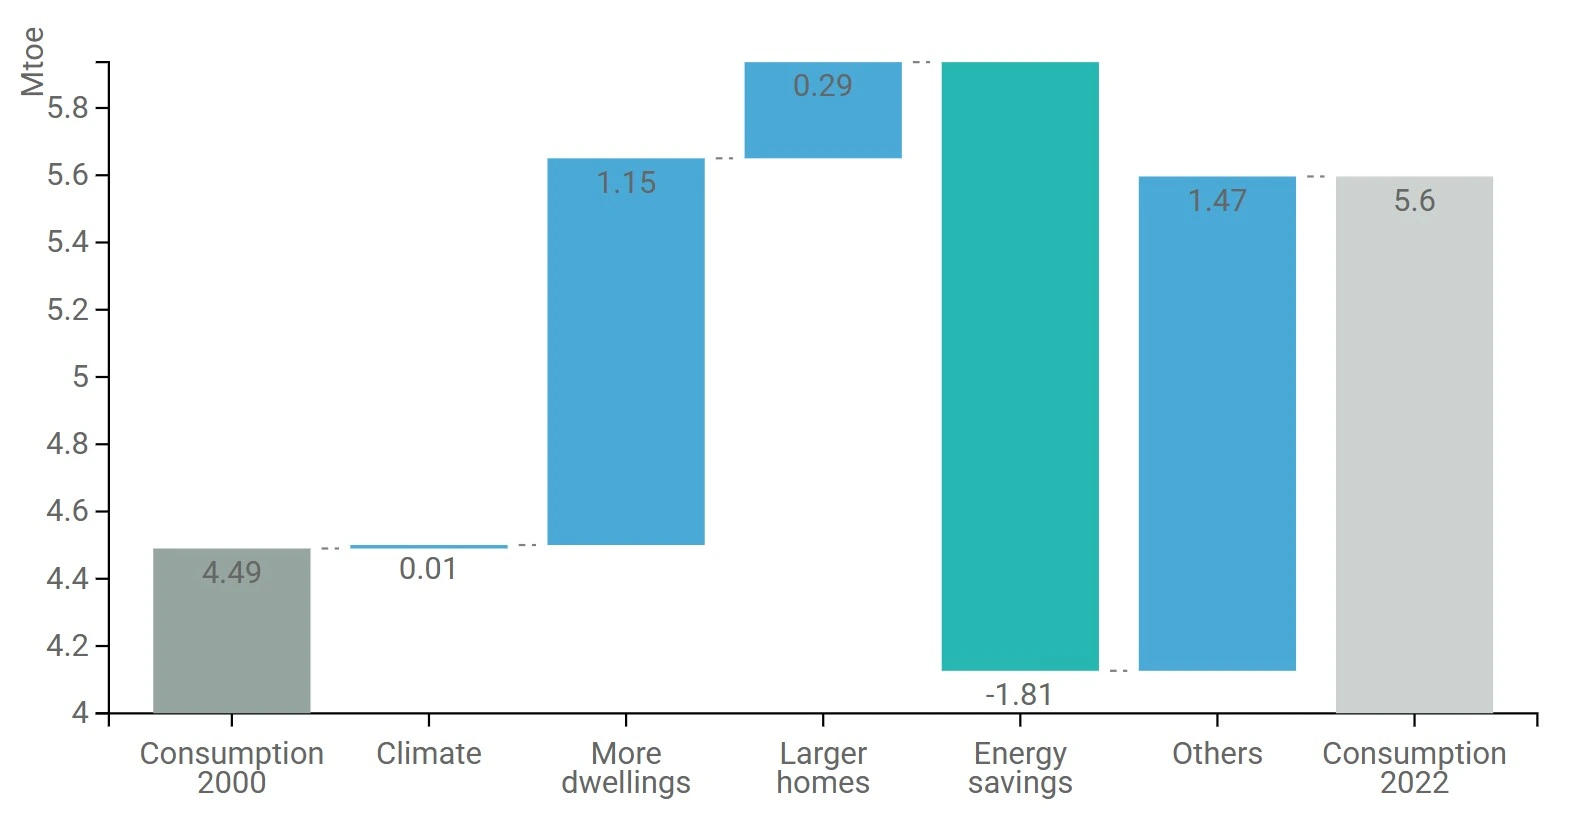
Figure 11: Main drivers of the energy consumption variation in households
Energy consumption for space heating in households has increased from the 2000 levels by 0.37 Mtoe. Energy savings more than offset the impact of increase in the number of occupied dwellings (activity) and the moderate growth of dwelling size. “Other” factors contributed to the growth by 0.6 Mtoe mainly corresponding to the increased use of ambient heat by heat pumps.
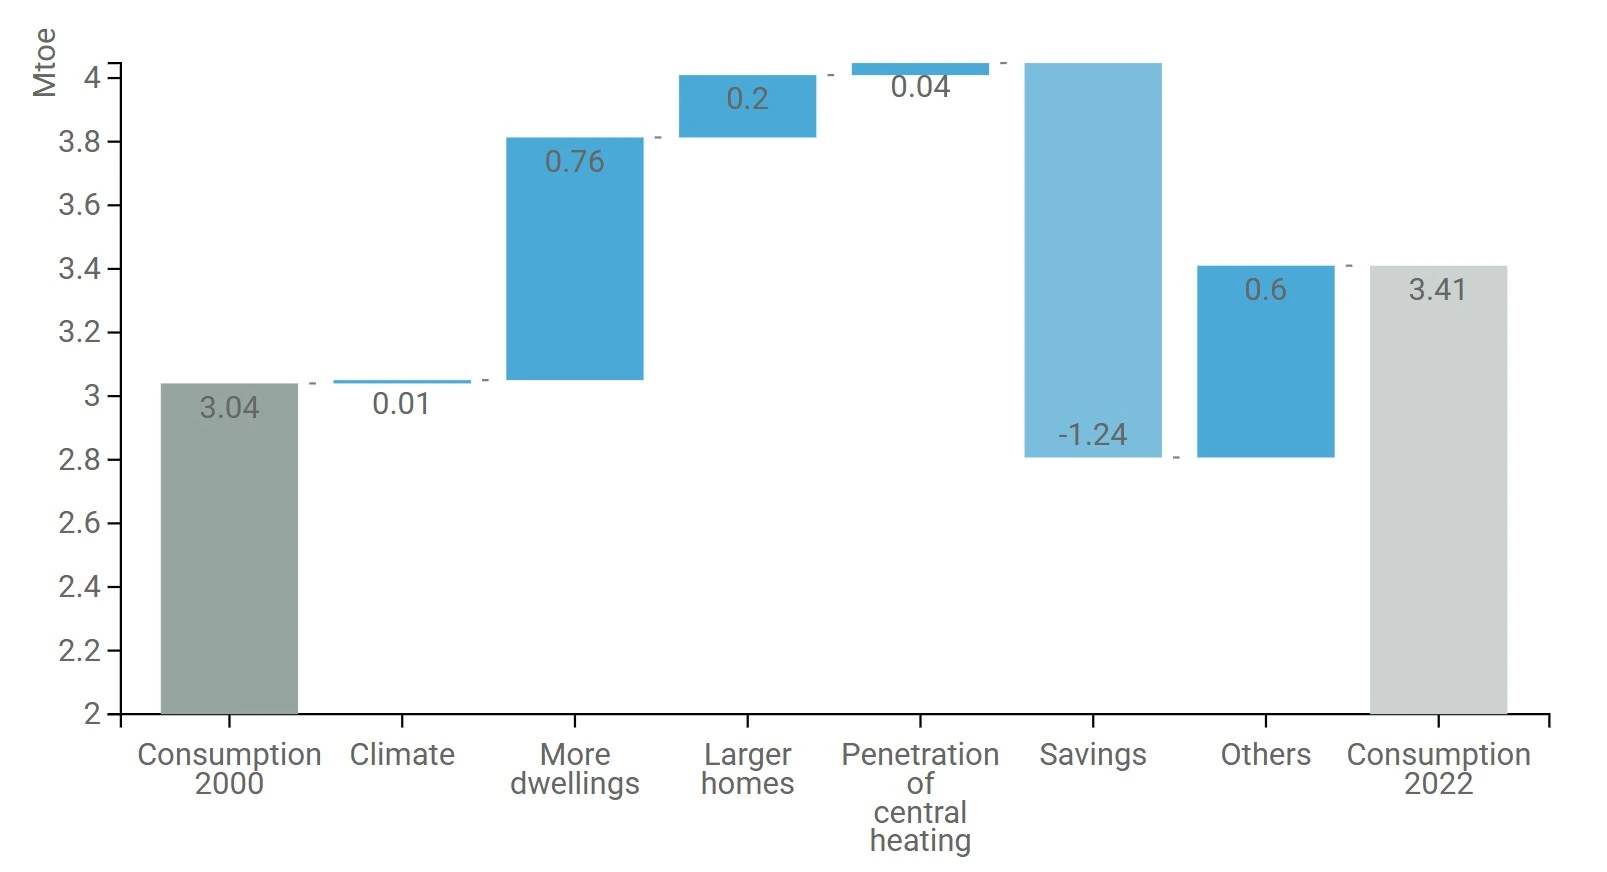
Figure 12: Main drivers of the space heating consumption variation of households
Both energy consumption and electricity consumption per m2 have considerably declined in the services sector after 2000, around 0.7%/year.

Figure 13: Energy and electricity consumption per m² in services (with climatic corrections)
In Finland, thermal building regulations were first introduced in 1976 and have become increasingly demanding thereafter. The building code for building renovation took force in 2013. Legislation governing nearly-zero energy buildings was issued in December 2016. The number of heat pumps has been growing rapidly as they are promoted in existing houses by income tax rebates, in oil heated households by subsidies (until mid-2025) and by information measures. Ground-source heat pump is the most popular main heating system in new single-family houses. There are energy efficiency agreements and an energy audit scheme in place in the private services sectors and for municipalities and joint municipalities.
| Measures | Description | Expected savings, impact evaluation |
| Decree on improving the energy performance of buildings undergoing renovation or alteration | National implementation of the EPBD directive regarding buildings undergoing renovation or alteration. | 9.80 PJ |
| Regulations for nearly-zero energy buildings | Regulations for nearly-zero energy buildings took force on 1 January 2018. | |
| Energy Efficiency Agreement of the Property and Building Sector – Rental Property Action Plan | Voluntary energy efficiency agreement for rental properties (dwellings) the period 2017-2025. | Cumulative total savings for EED Art 7/8 in 2030 are reported together with the energy efficiency agreement for industry (see IND-FI1108) |
| Energy Efficiency Agreement of the Property and Building Sector – Commercial Property Action Plan | Voluntary energy efficiency agreement for commercial properties for the period 2017-2025. | Cumulative total savings for EED Art 7/8 in 2030 are reported together with the energy efficiency agreement for industry (see IND-FI1108) |
Regulations for nearly-zero energy buildings
Objectives
-
Comply with EPBD goal: ensure all new buildings meet nZEB standards. Transposed into Finnish law via a decree under the Land Use and Building Act in 2017.
- Support Finland’s carbon neutrality target by 2035, integrating energy efficiency and emissions reductions from the earliest stages of construction.
Key Features & Standards
- Legal Framework
- In 2017, Finland adopted a government decree interpreting nZEB requirements based on national energy performance calculation methods.
- Under the new Building Act (Rakentamislaki) effective from 1 Jan 2025, updated sustainability, low-carbon design, and lifecycle emissions criteria become part of the core building code.
- Energy Performance Requirements
-
nZEB primary‑energy thresholds depend on building type and size:
-
Single-family houses: between ~200 and 92 kWh/(m²·y), decreasing as size increases
-
Apartment buildings: about 90 kWh/(m²·y) including HVAC, hot water, lighting, and appliances.
-
-
Finland’s thresholds exceed EU recommendations by a factor of ~1.5 due to national calculation methodologies and very low primary‑energy factors.
-
- Included Energy Flows
-
Finnish calculations include lighting and appliances, in addition to HVAC and hot water, setting a more holistic energy baseline per EPBD definitions.
-
Incentives
Regulatory compliance for nZEB is mandatory for new buildings — not incentive‑based—but is accompanied by parallel support mechanisms:
-
EPC schemes and building energy audit tools coordinated by Motiva Oy and the Ministry of the Environment.
-
From 2025, developers must submit a climate report, including carbon footprint and handprint metrics; this becomes fully enforceable by 1 Jan 2026.
Sanctions
-
Municipal building permit enforcement ensures adherence to nZEB standards; non-compliant projects may be refused.
-
Climate reports and low-carbon product lists (as part of the updated code) must accompany permit applications post‑2026.
Results
-
Finland’s nZEB rules launched in 2017 made all new buildings comply with high efficiency requirements.
-
However, due to relatively high primary‑energy thresholds, Finnish nZEB targets are less stringent compared to EU recommendations; simulations show they exceed them by ~1.5×.
-
The 2025 building regulation enhances rigour by integrating life-cycle carbon assessment, climate reporting, and product-level carbon limits—boosting future retrofit quality and nZEB alignment.