
Overview
In 2023, the final energy consumption in Montenegro was 0.78 Mtoe, approximatively 20% higher than in 2014 (0.64 Mtoe). Residential sector recorded 2% decrease in total energy consumption since 2014, reaching a share of 34% of total final energy consumption in 2023 (-7 percentage points). Transport increased consumption by 85% with a share reaching 39% (+14 pp). Industry sector decreased its consumption by 36% with a share of 11% in 2023 (-10 pp). Services and non-specified increased their consumption by 60%, reaching 15% of the total final energy consumption in Montenegro in 2023 (+3.7 pp). Agriculture consumes only 1% of total final consumption, which shows no significant change (-0,4 pp).
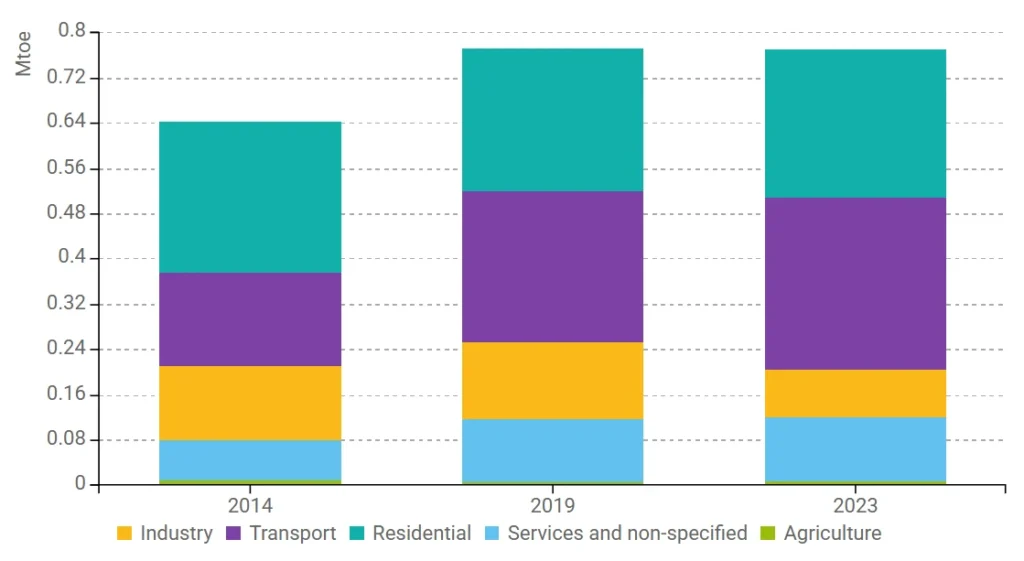
Figure 1: Final energy consumption by sector (with climatic corrections)
Both primary and final energy intensity improved in the period from 2010 to 2023. Primary energy intensity decreased by 32%, or 2,9%/year on average, from 0.34 koe/€2015 in 2010 to 0.23 koe/€2015 in 2023. Over the same period final energy intensity decreased by 23% or 2,0%/year from 0.21 koe/€2015 to 0.17 koe/€2015 in 2023.
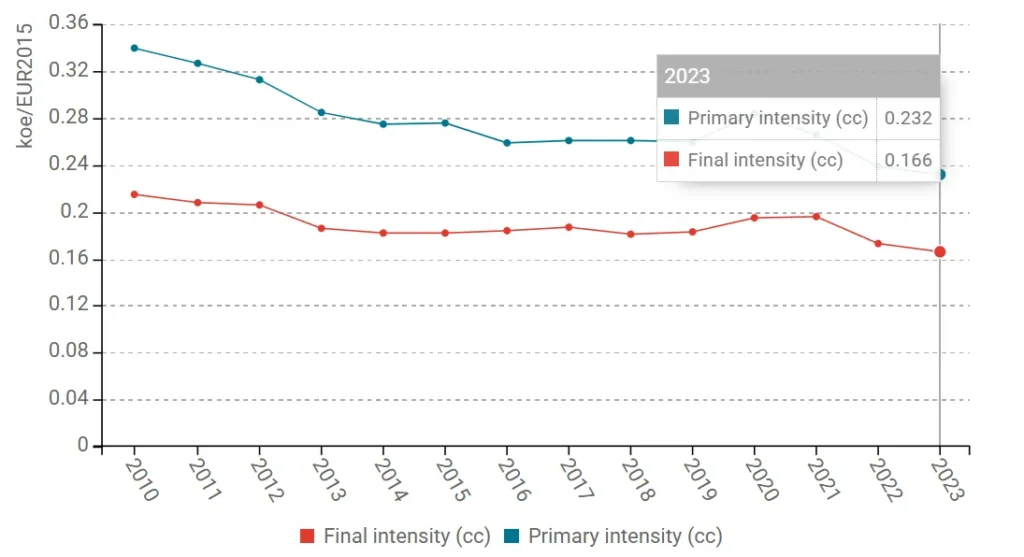
Figure 2: Primary and final intensities (with climatic corrections)
From 2014 till 2023, final intensity by sector recorded different trends. The largest decrease was recorded in Industry sector (-48% or 7.1% per year), followed by agriculture (-26% or 3.3% per year). Over the same period, the service sector recorded an increase in energy intensity by 12% (1.2% per year).
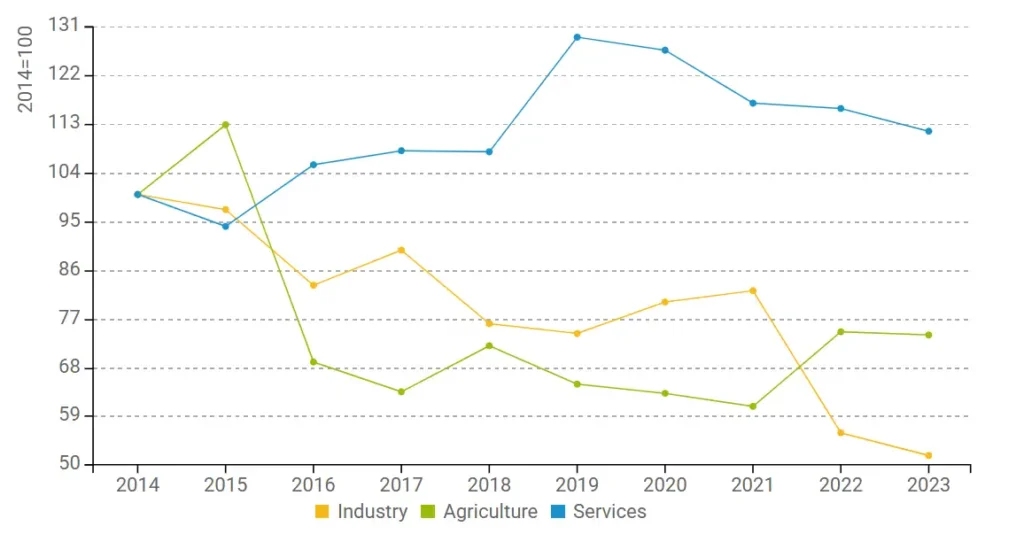
Figure 3: Final intensity by sector
Total energy supply in Montenegro, over the period from 2010 to 2023, has decreased by 0.07 Mtoe, from 1.13 Mtoe in 2010 to 1.06 Mtoe in 2023. This reduction in total energy supply took place despite an increase in final consumption (+ 0.04 Mtoe) and was mainly influenced by a decrease in the net consumption of power sector (-0.08 Mtoe), and consumption for other transformations and non-energy uses (-0.02 Mtoe each).
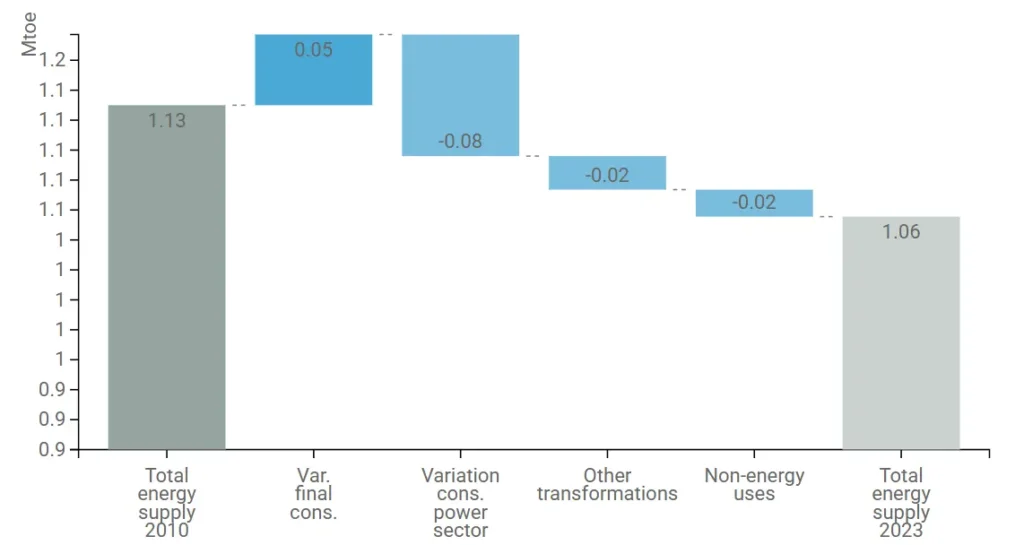
Figure 4: Main drivers of the total energy supply variation
Buildings
For the period 2014 to 2023, final energy consumption in residential sector, has decreased slightly, from 0.27 Mtoe to 0.26 Mtoe in 2023 (with climatic corrections). While sector services recorded significant increase of 60% in energy consumption, from 0.07 Mtoe to 0.114 Mtoe in 2023.
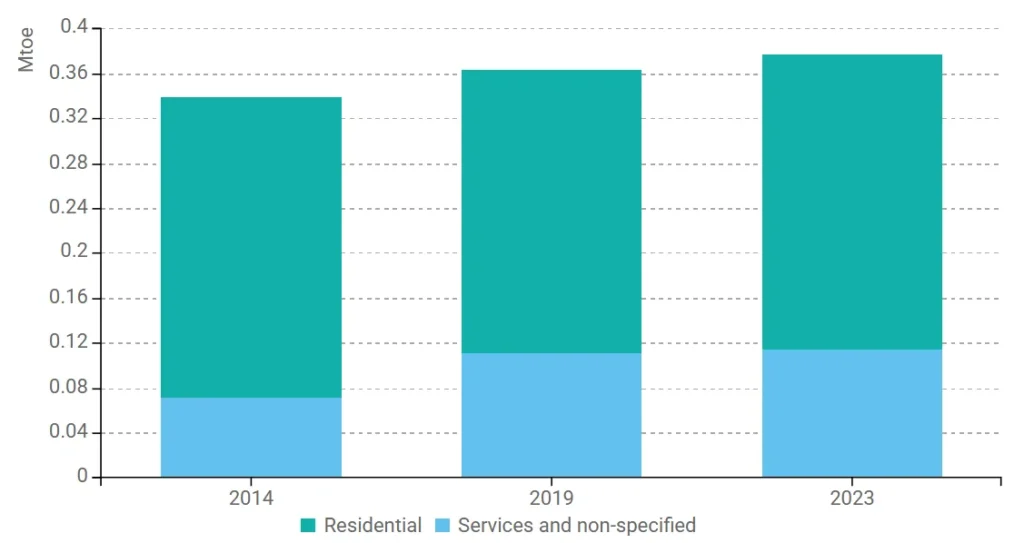
Figure 5: Final energy consumption in buildings (with climatic corrections)
Over the period 2010 to 2023 electricity consumption per dwelling increased by 18%, while the total energy consumption per dwelling decreased by 3%. Significant increase in electricity use was recorded from 2020 after the Covid crisis followed by the energy crises. This may be due to fact that electricity prices in Montenegro stayed at the same level during the energy crisis while prices of other energy sources have significantly increased and most of the people switched to the cheaper option.
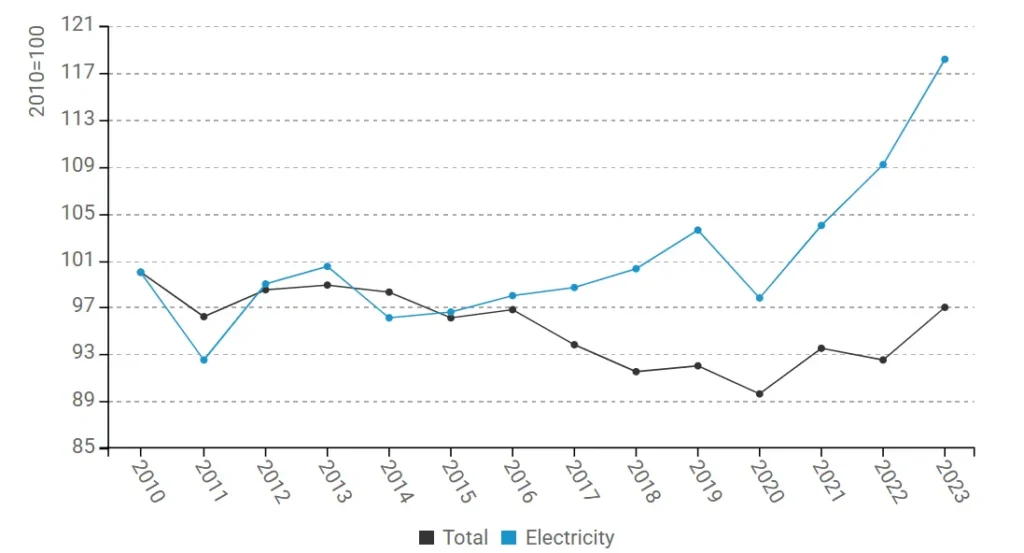
Figure 6: Energy and electricity consumption in households per capita (with climatic corrections)
Energy consumption per capita for space heating in households (with climatic corrections) has kept at constant level over the period 2010 to 2023 with minor variations (-6% for the period or 0.5 per annum on average). From the data set it is evident that energy consumption per capita for space heating in households has slightly decreased mainly due to the incentive programs for subvention for implementation energy efficiency measures in households. Number of homeowners recognized these attractive programs that have been implemented during this period.

Figure 7: Energy consumption per capita for space heating in households (with climatic corrections)
For the period 2010-2023, in the structure of energy consumption per capita by end-use in households (except space heating) most of the energy is used for cooking followed by water heating. Significant increase of 27% of energy consumption for air cooling can be noticed, for the period 2010-2023, which may relate to with global warming, while cooking recorded decrease by 13% which may be due to the replacement of old cookers by new and more energy efficient appliances.
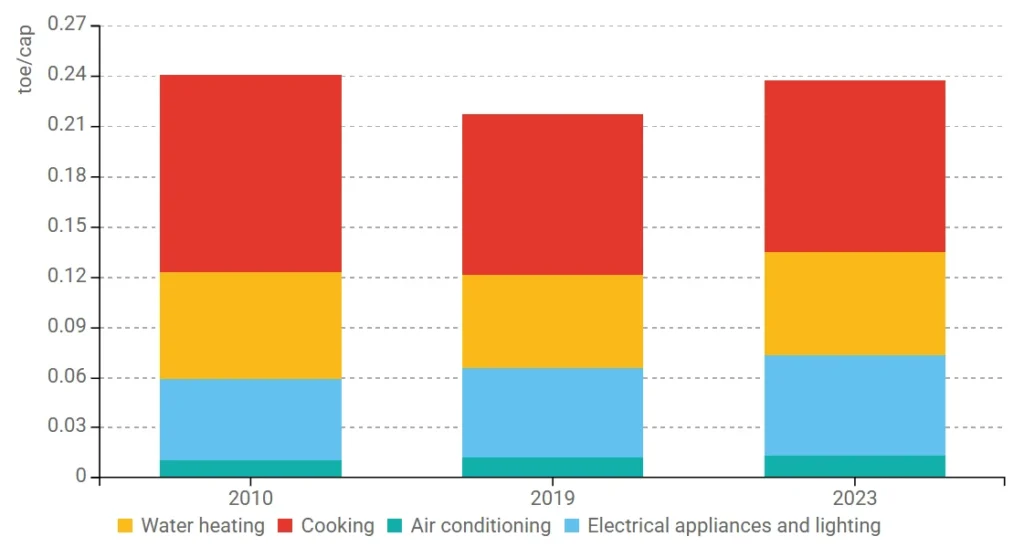
Figure 8: Energy consumption per capita by end-use in households (except space heating)
References: ODYSSEE-MURE, “Country profiles: EU Energy Efficiency & Trends policies.